Dashboard
The Dashboard screen gives a high-level performance overview across your whole database estate.
Visual styles
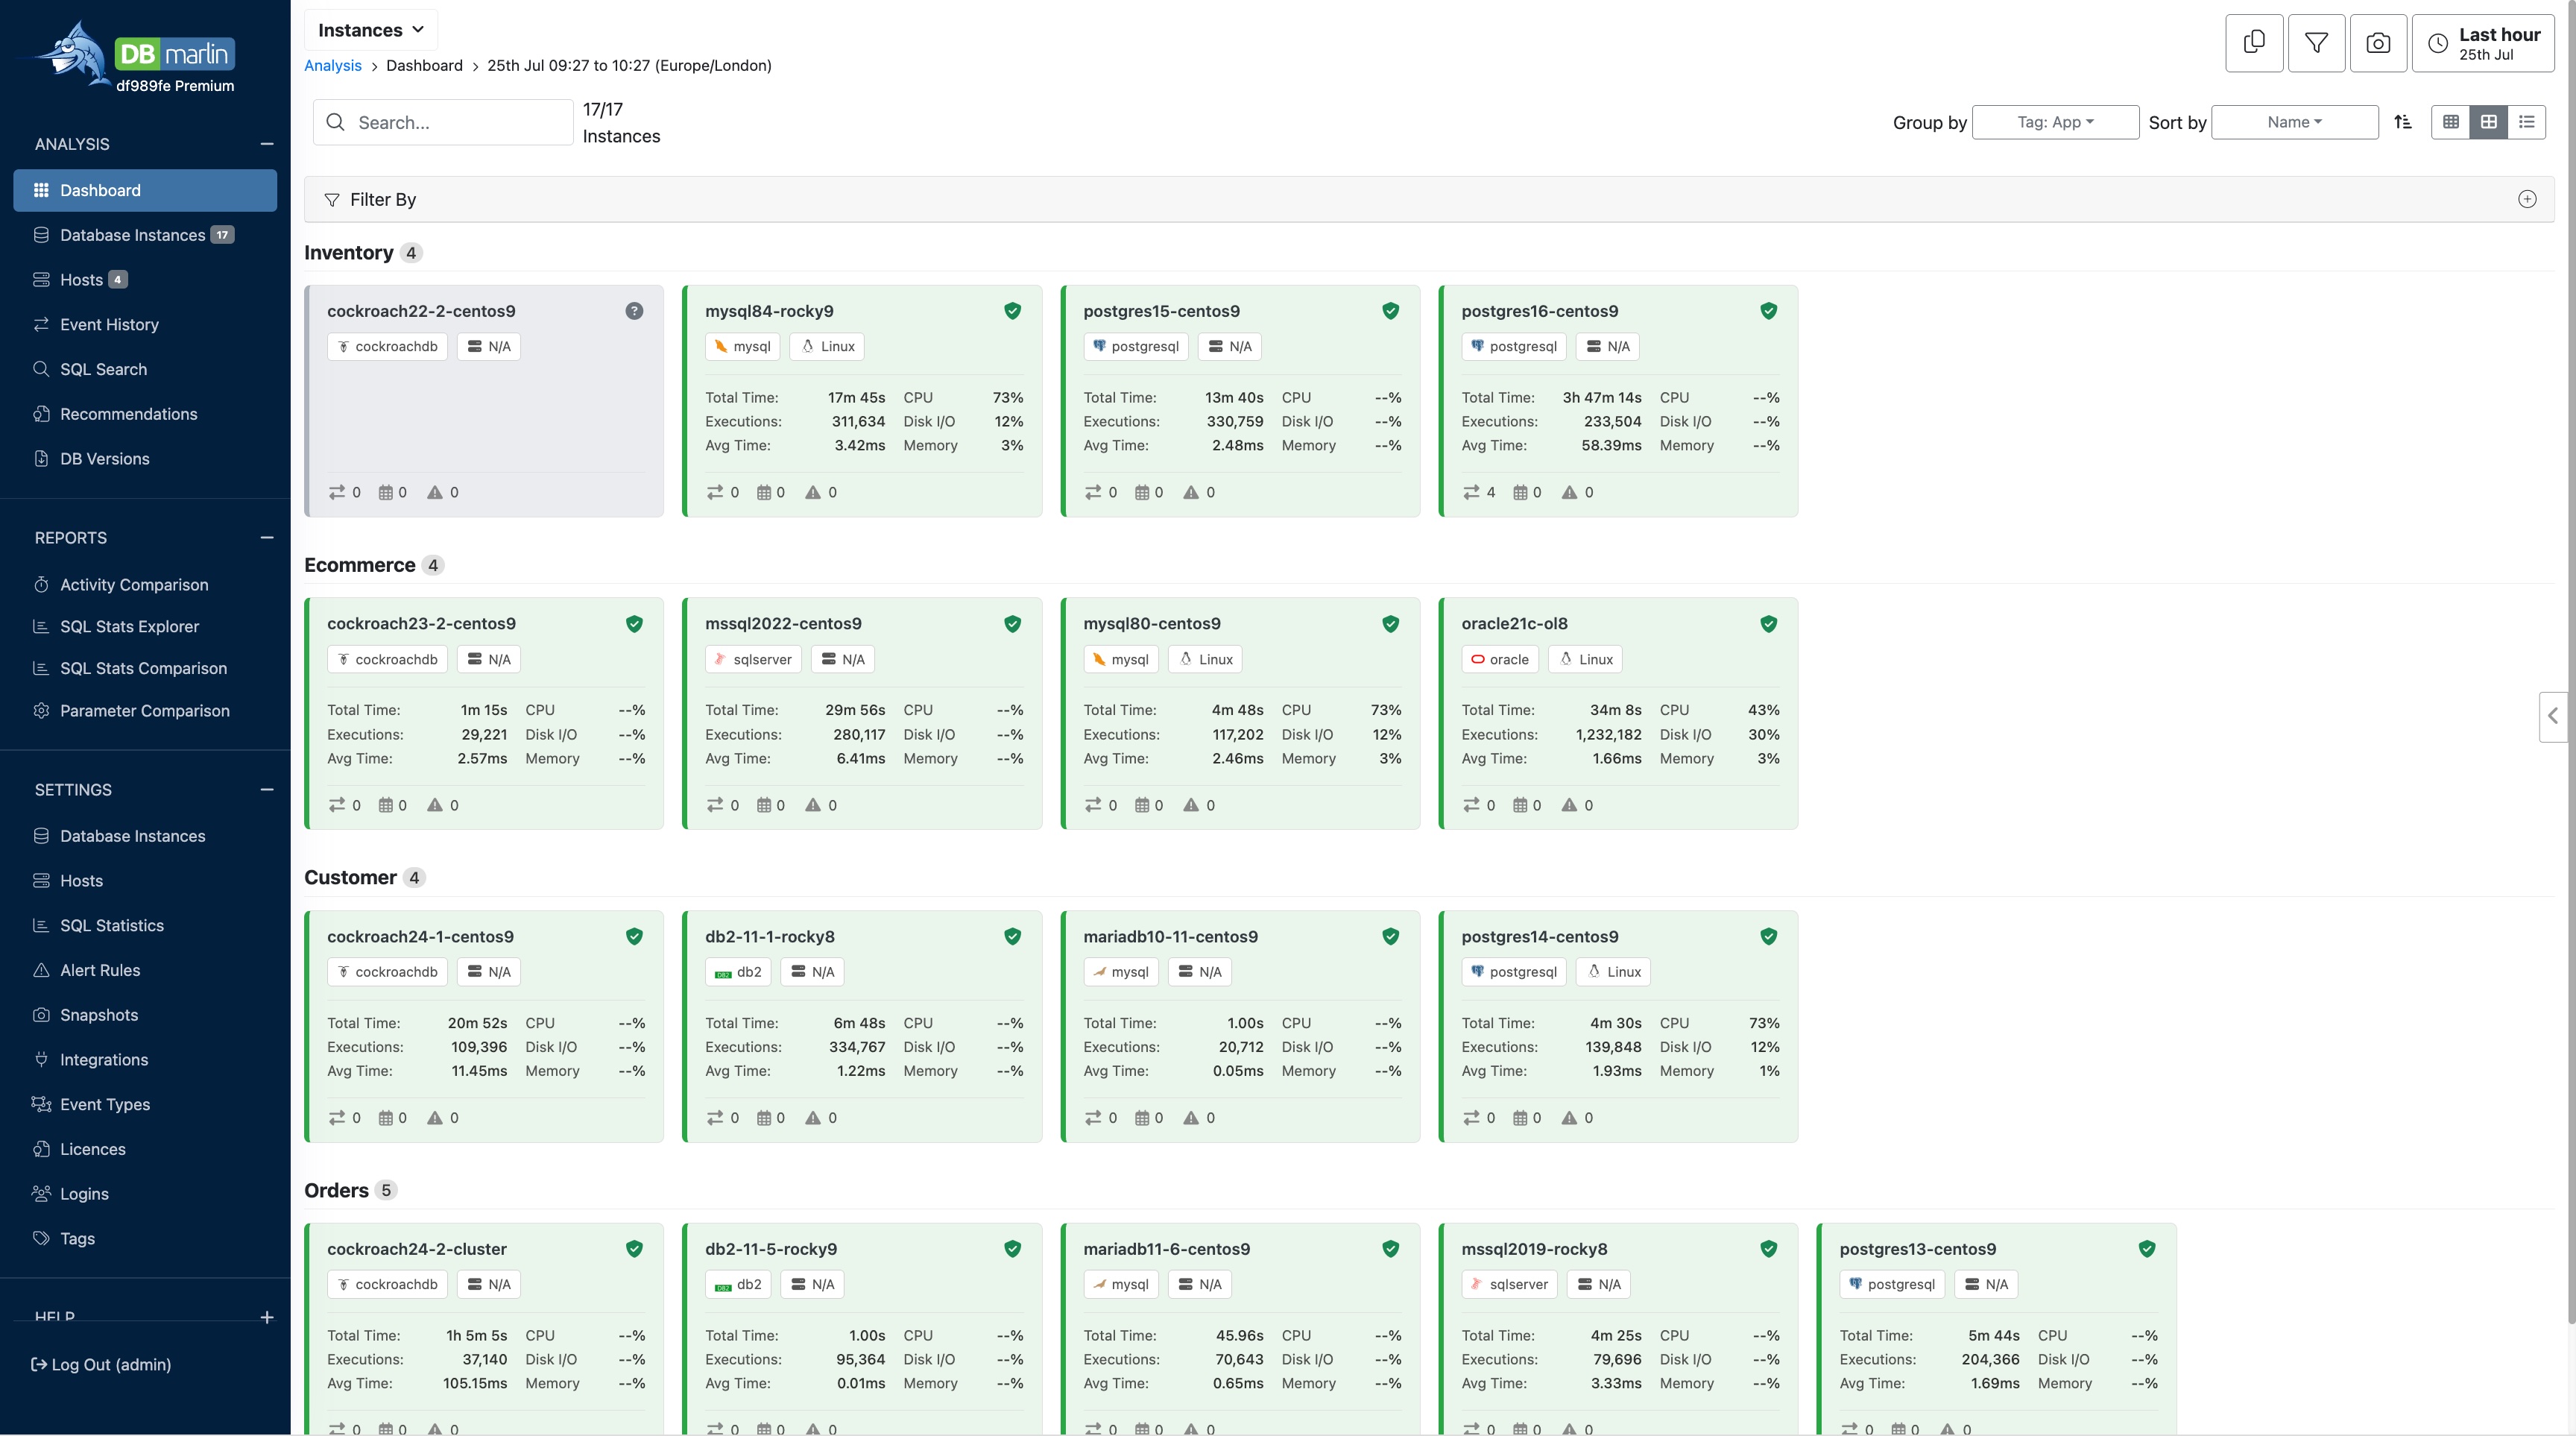
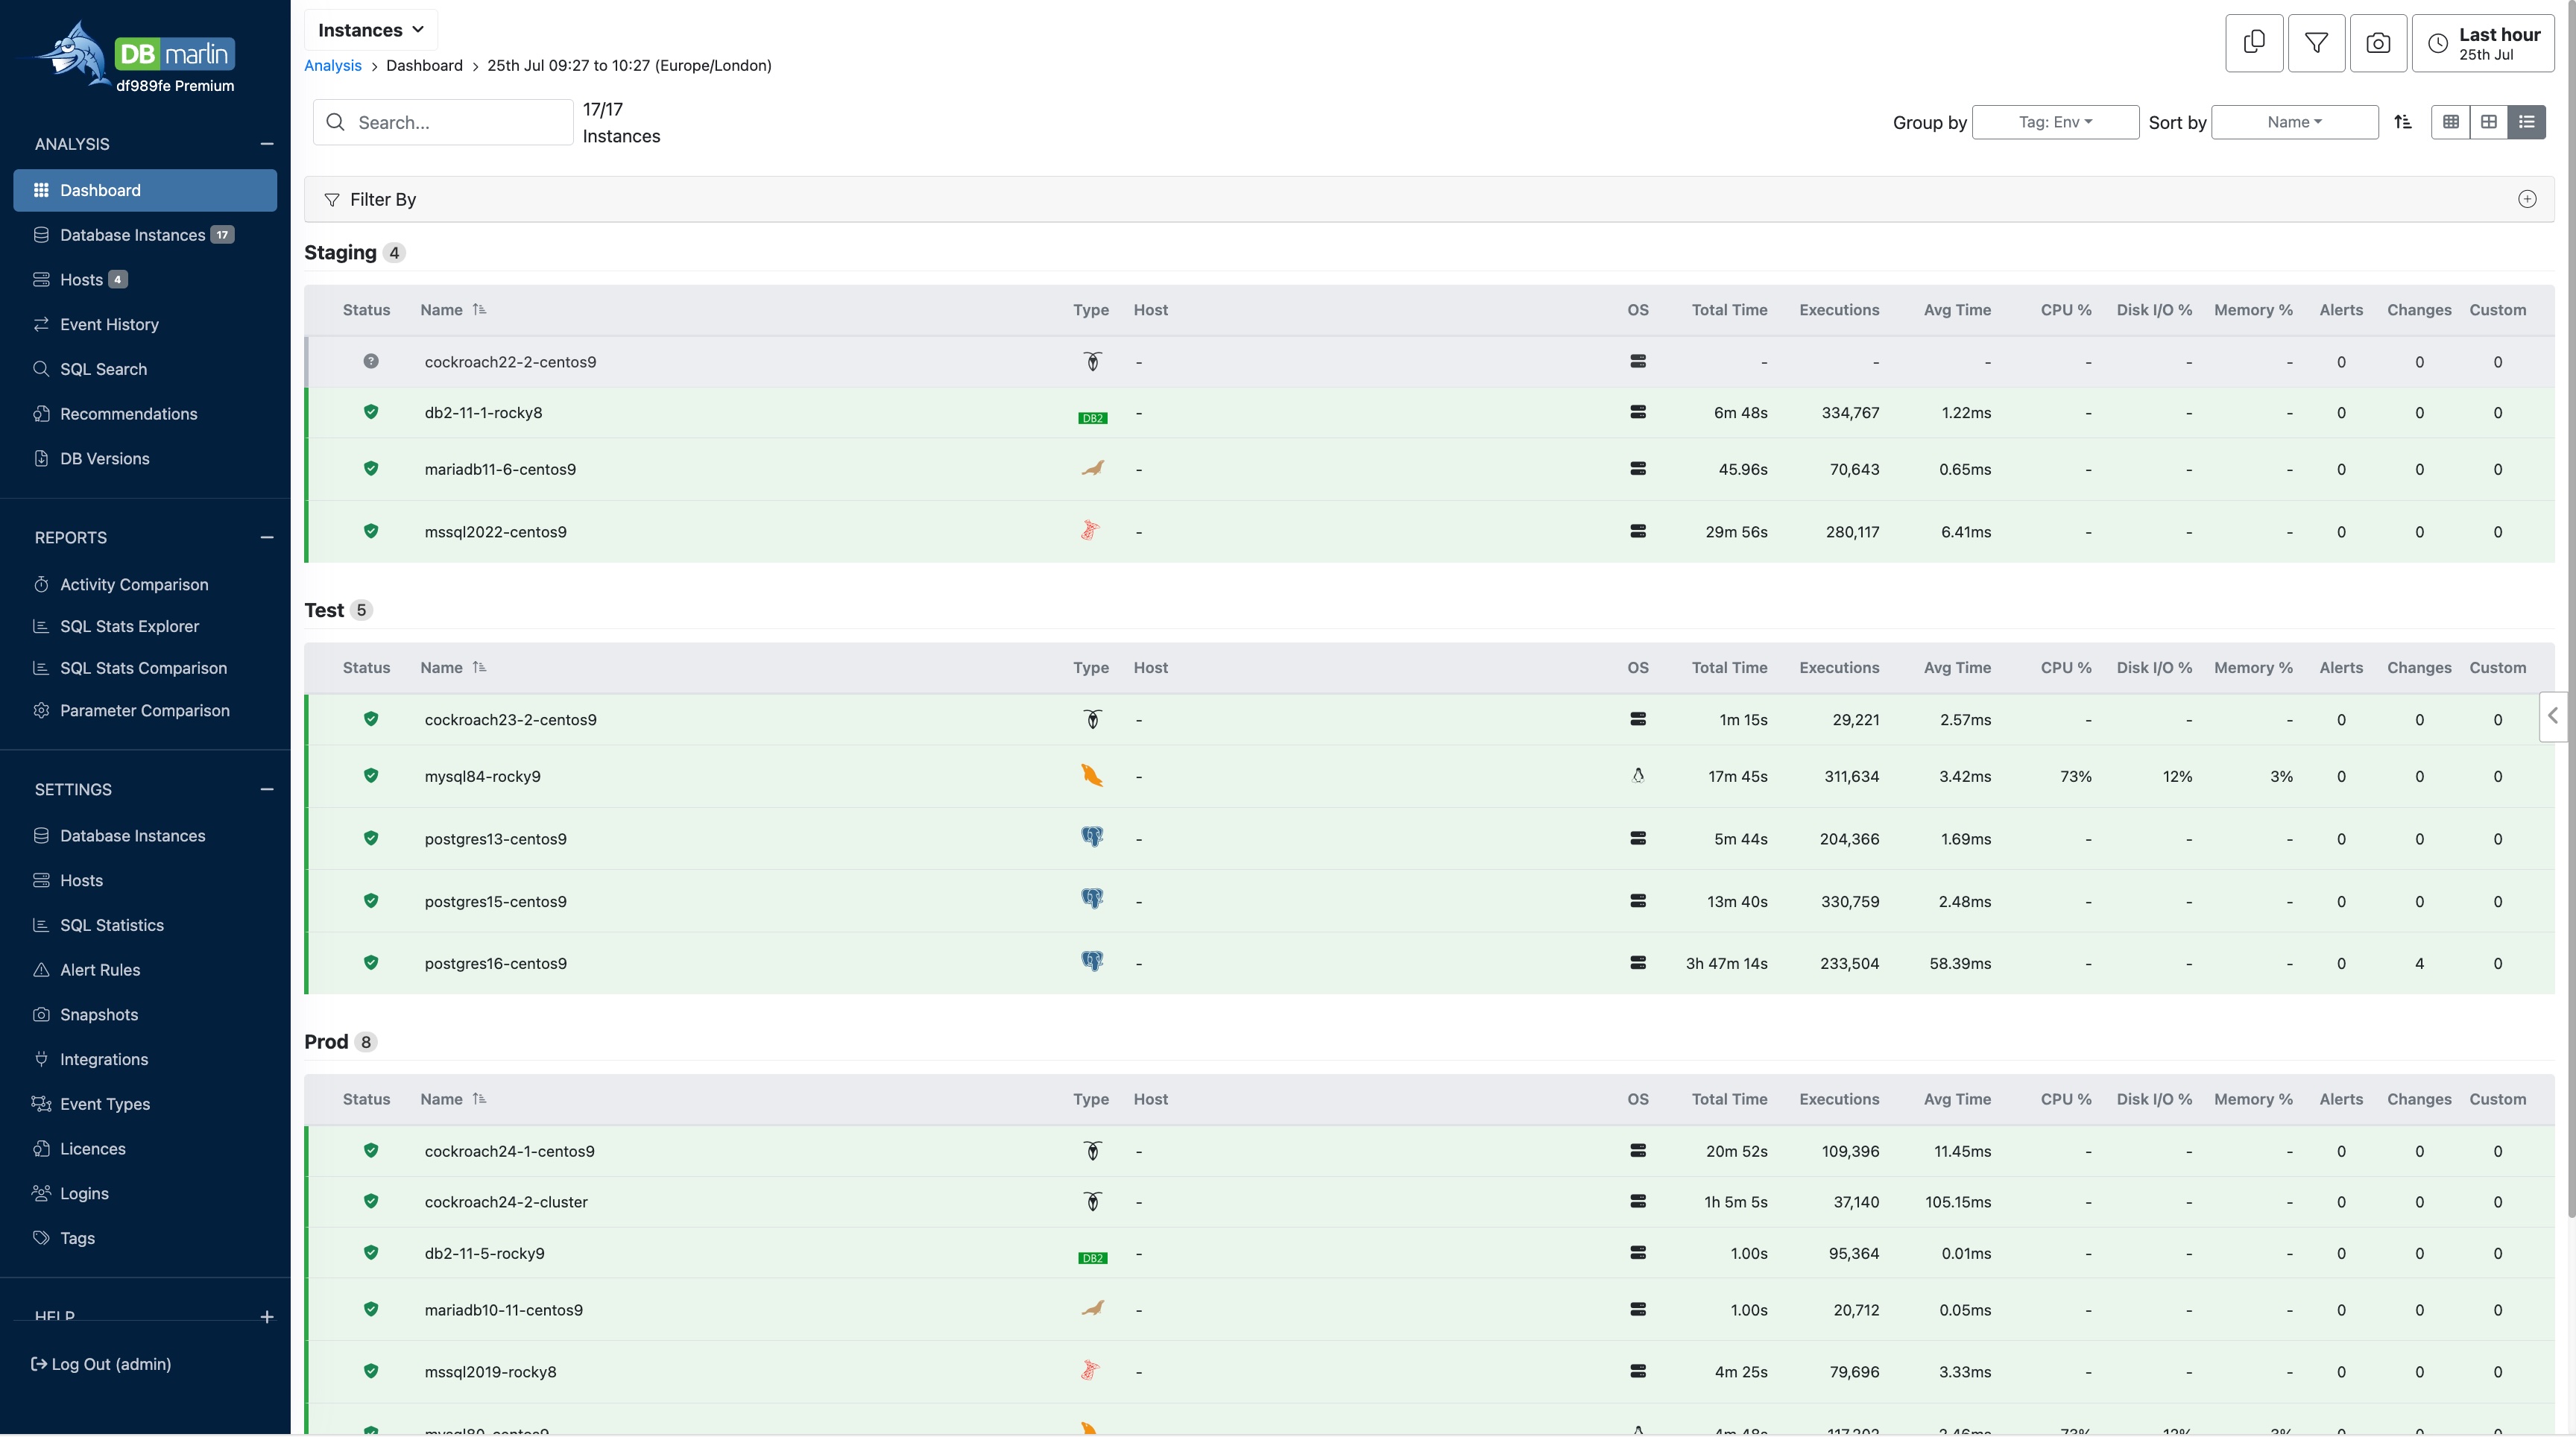
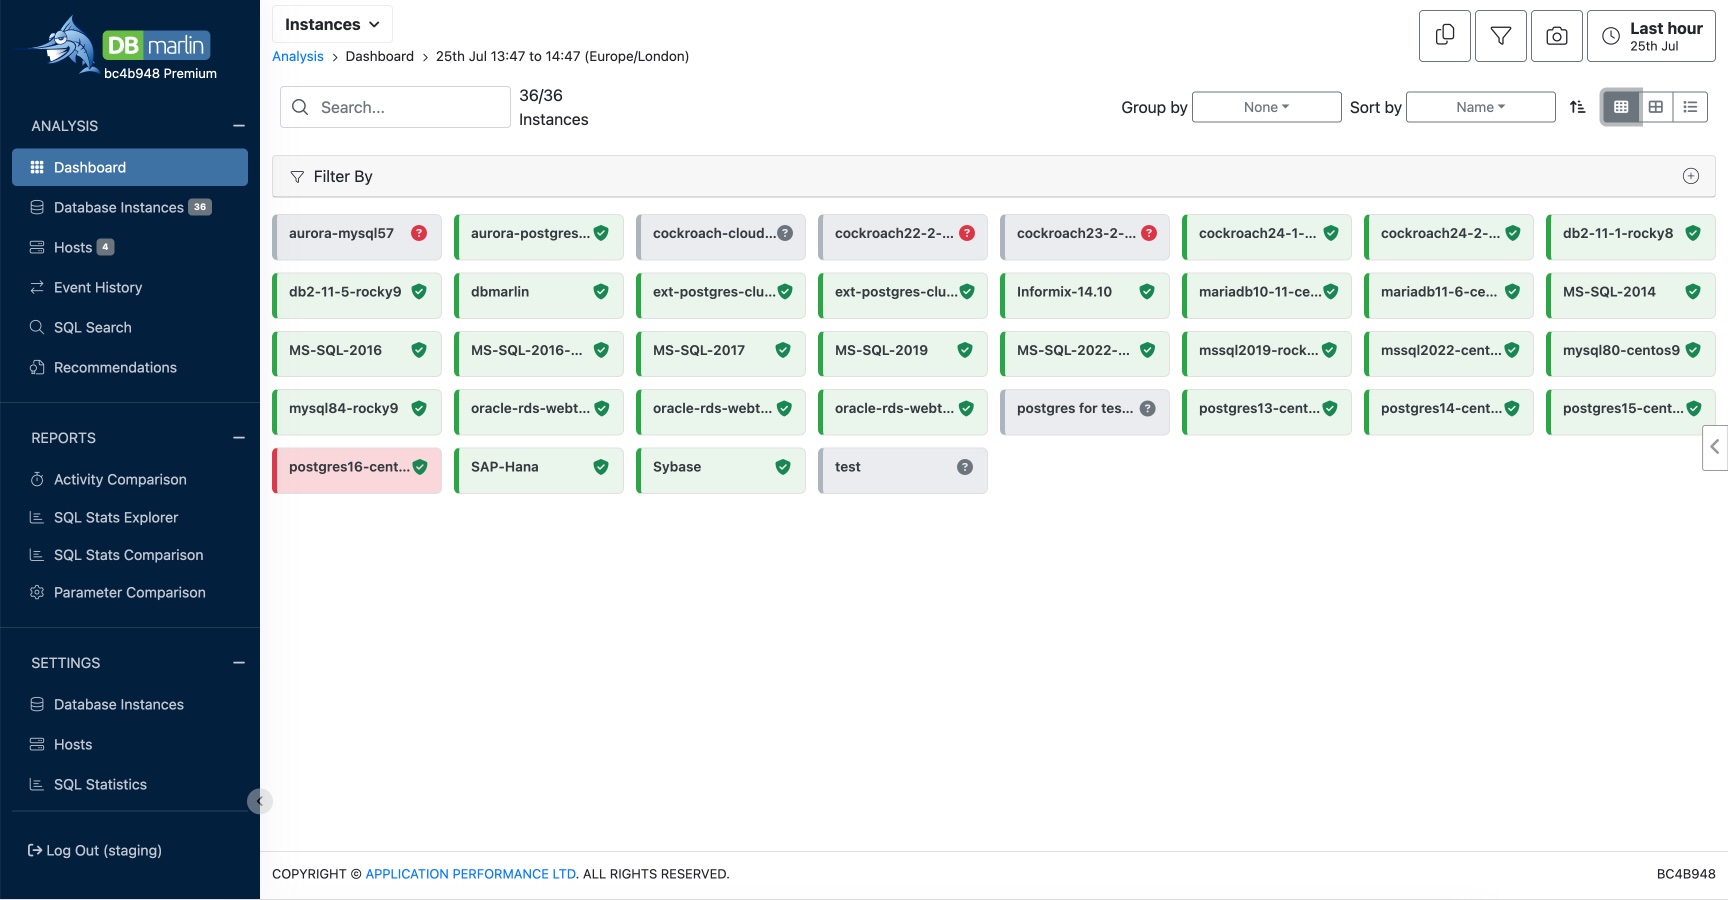
You can choose between large tiles, small tiles or tabular view using the icons in the top right.
Using small tiles, you can fit more instances on the screen but with less detail. Mouseover on the tile will show the larger tile to see the details.
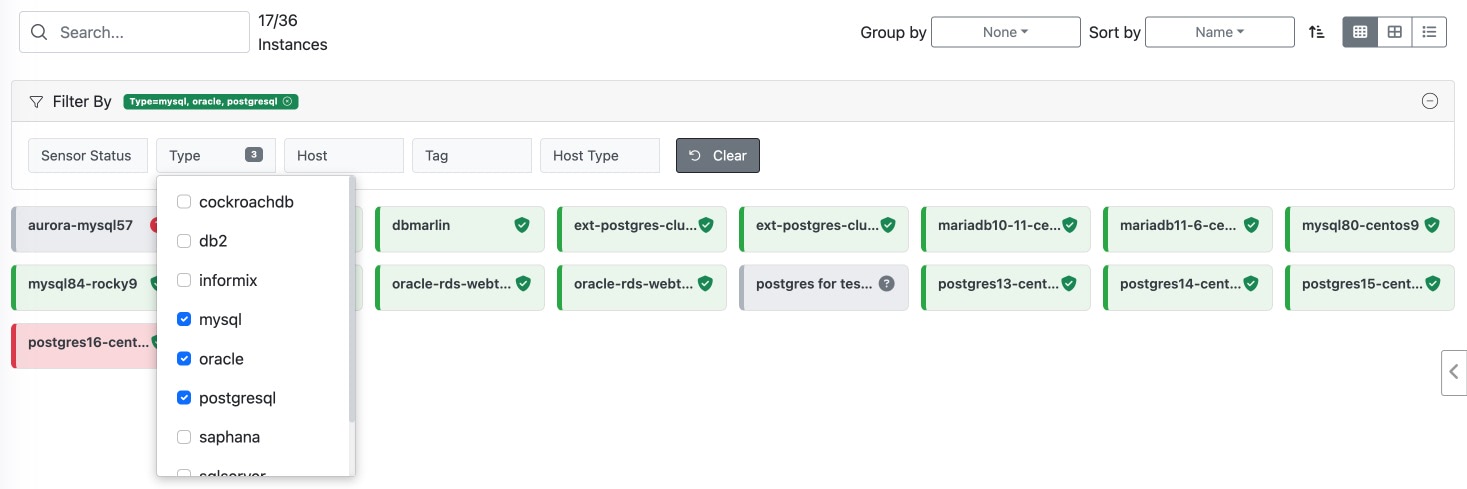
Sorting and grouping
At the top of the screen you can select Group by and Sort by options from the dropdown list. There is also a filter panel which lets you filter out instances to only show the ones you are interested in.
Slide out panels
Clicking on the instance name in the tile you will get a slideout panel on the right of the screen showing some of the top level instance and host level performance metrics and events.
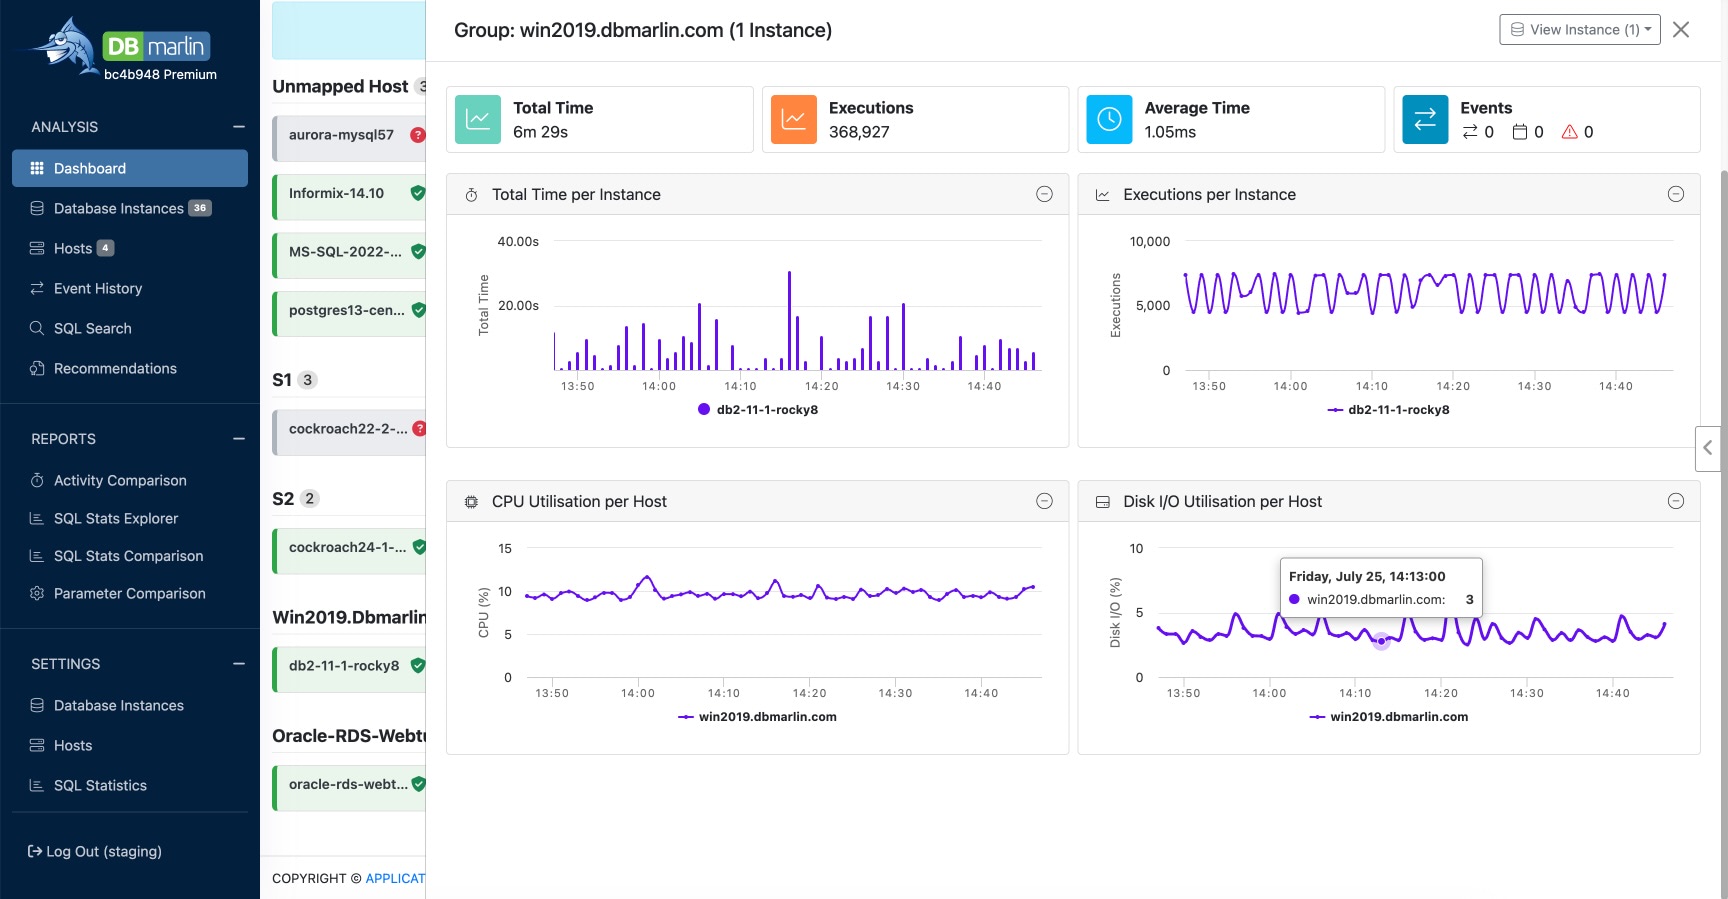
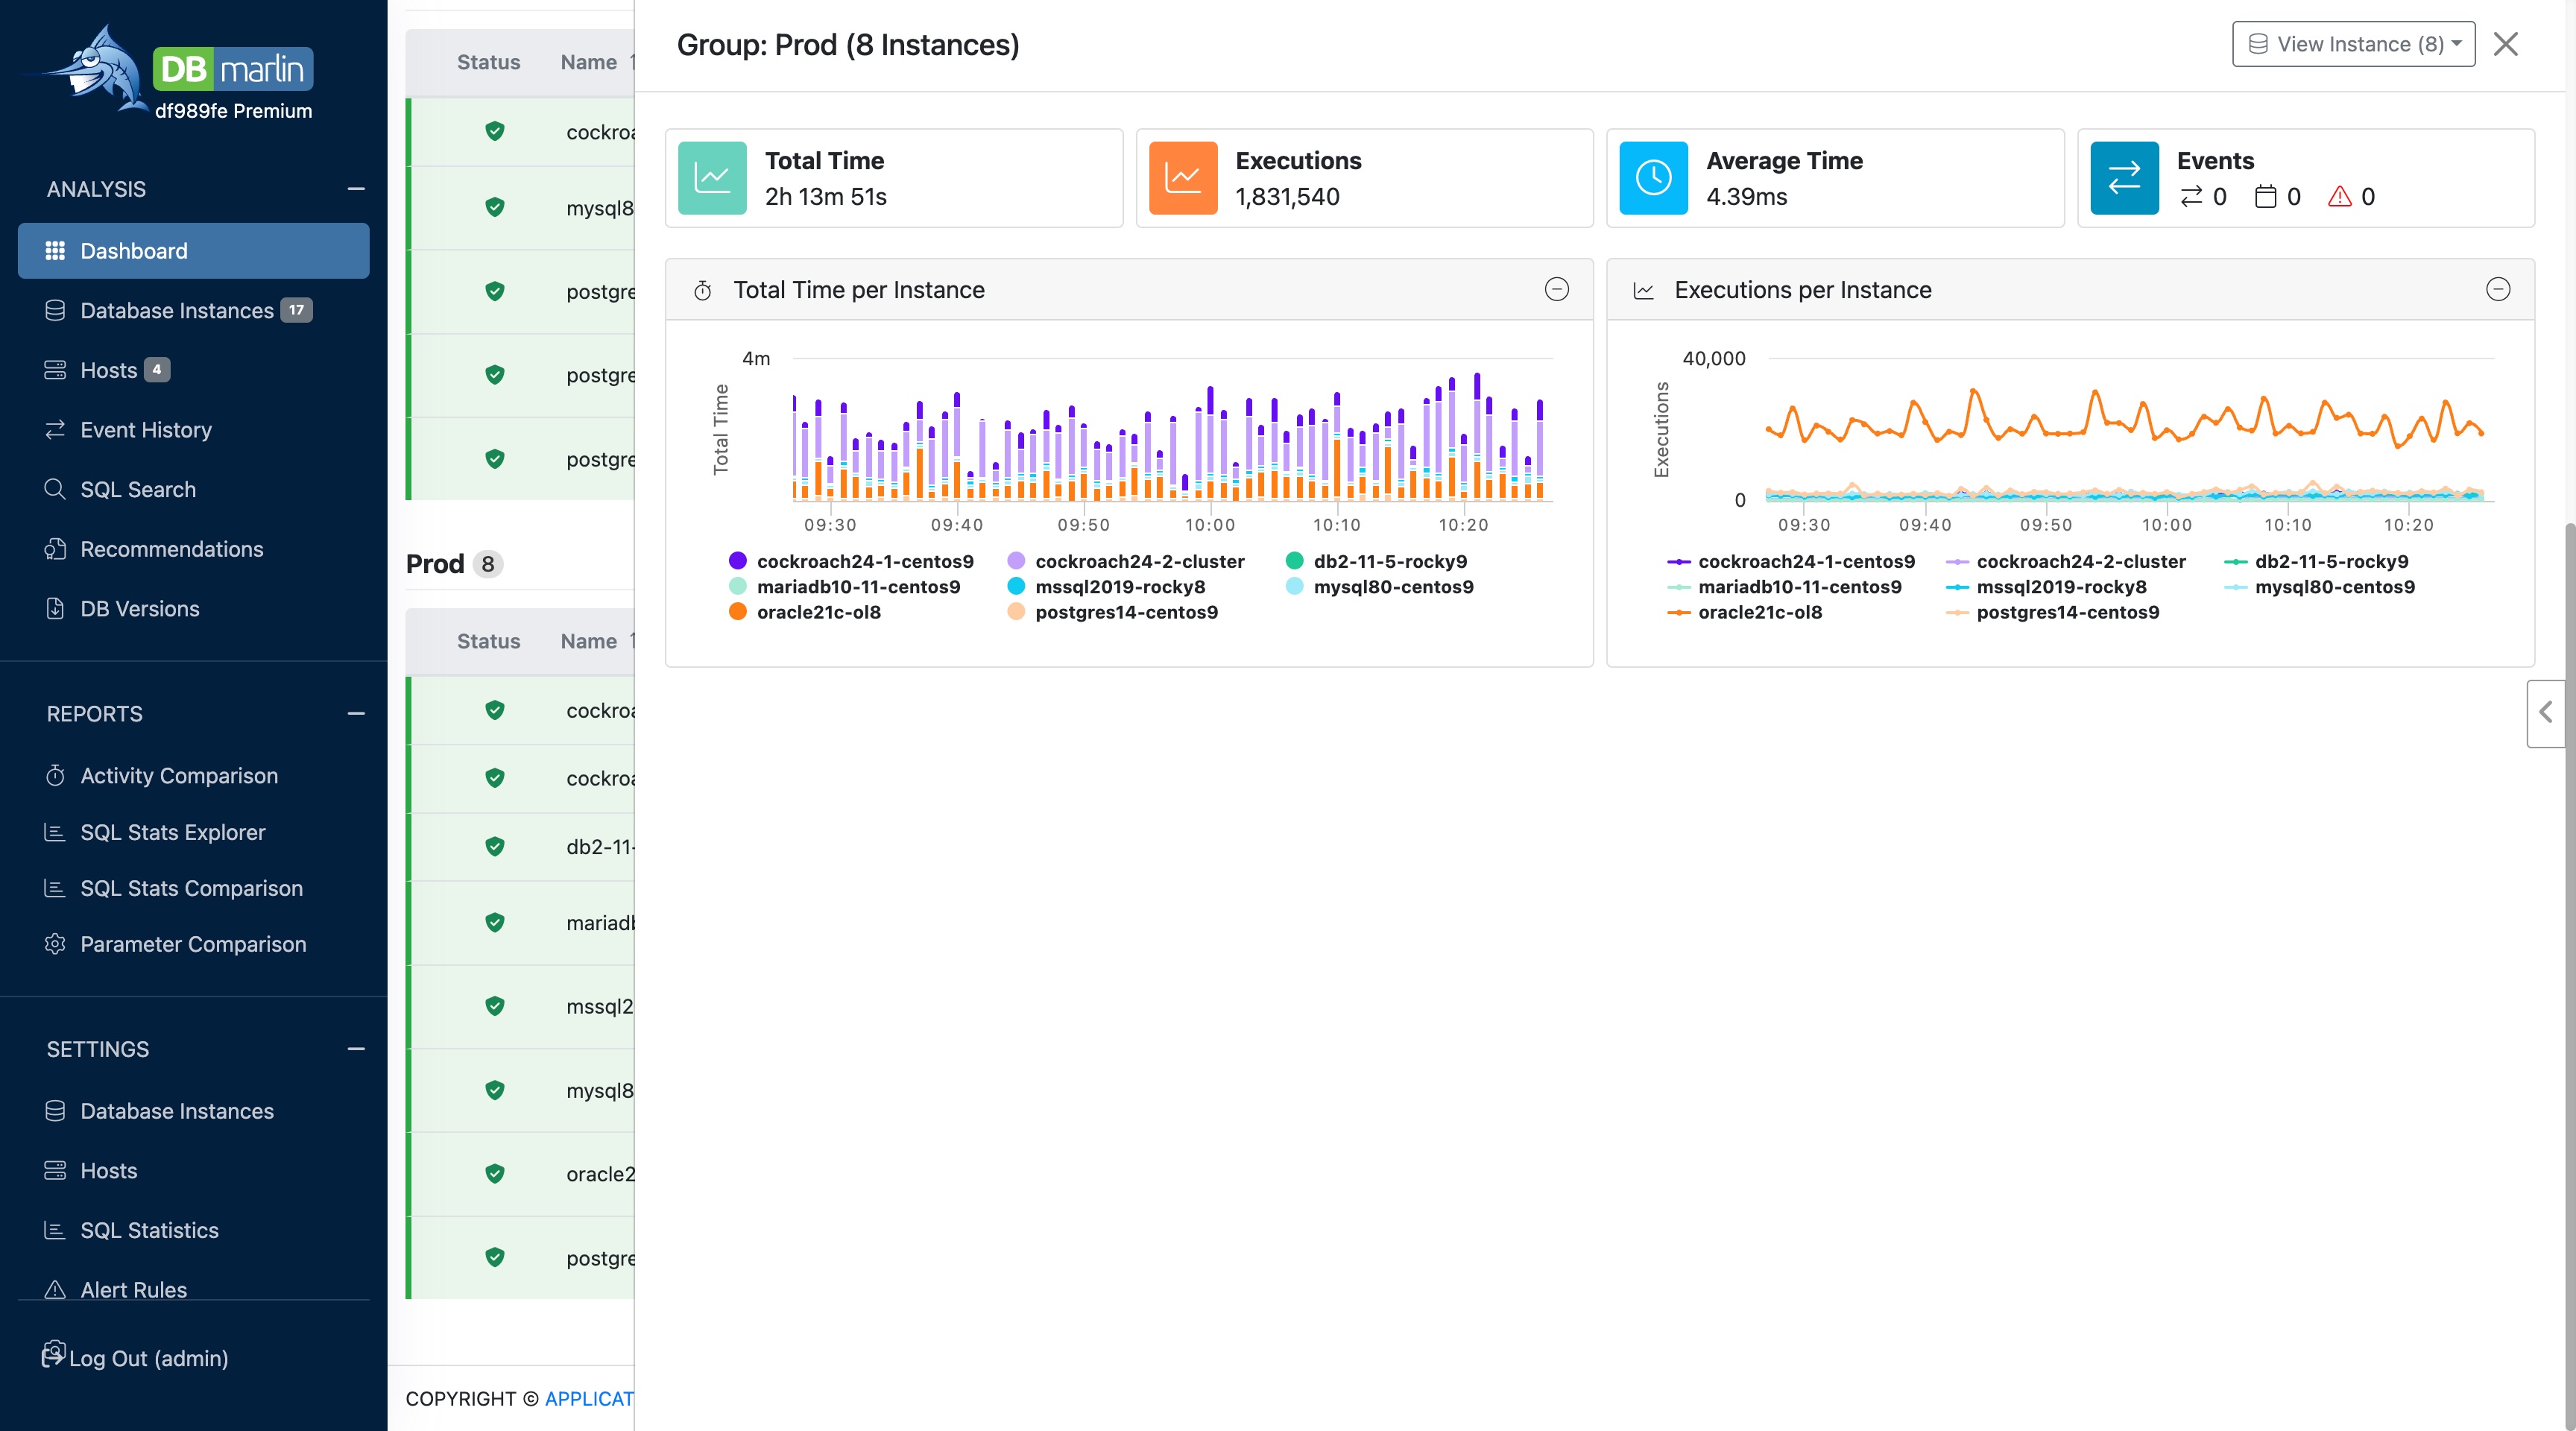
If you have applied a group by option, then you can also click on the group name to see a slide out panel with the performance metrics and events for the whole group. In the example below click on the group 'Prod' is showing data for all 8 instances within the group.