MongoDB Performance Monitoring Tool

DBmarlin 6.1 ships with full MongoDB support. DBmarlin has covered relational engines since day one. MongoDB breaks new ground as the first non-relational database on the platform. If you already know your way around DBmarlin for PostgreSQL or Oracle, nothing changes here. The interface is identical, the query-level depth is identical, and the three-clicks-to-root-cause workflow applies just the same.
Mixed Database Estates Need a Single Monitoring Platform
MongoDB rarely lives alone. It tends to sit alongside relational engines, often PostgreSQL or SQL Server, sometimes Oracle. Each of those databases comes with its own monitoring tooling. MongoDB Ops Manager handles the MongoDB side. Something else covers PostgreSQL. Yet another tool watches SQL Server. None of them share data, and correlating a problem across engines means flipping between dashboards and hoping the timestamps line up.
DBmarlin already covers 10 relational database engines in a single platform. MongoDB brings that number to 11 and means you can investigate a MongoDB slowdown using the exact same workflow you would use for a PostgreSQL issue or an Oracle bottleneck.
MongoDB Features in 6.1
The release includes four core capabilities, each adapted for how MongoDB operates.
Activity View at one-second granularity. Statement performance and resource consumption all update every second. Most other MongoDB monitoring tools poll at 30 or 60-second intervals, which means short-lived spikes get averaged out and never show up. At one-second resolution, those spikes are visible and traceable.
Statement Statistics. DBmarlin ranks individual MongoDB operations by execution count, duration, and CPU time. Instead of a general “the database is slow” signal, you get a sorted list of exactly which queries are consuming the most resources.
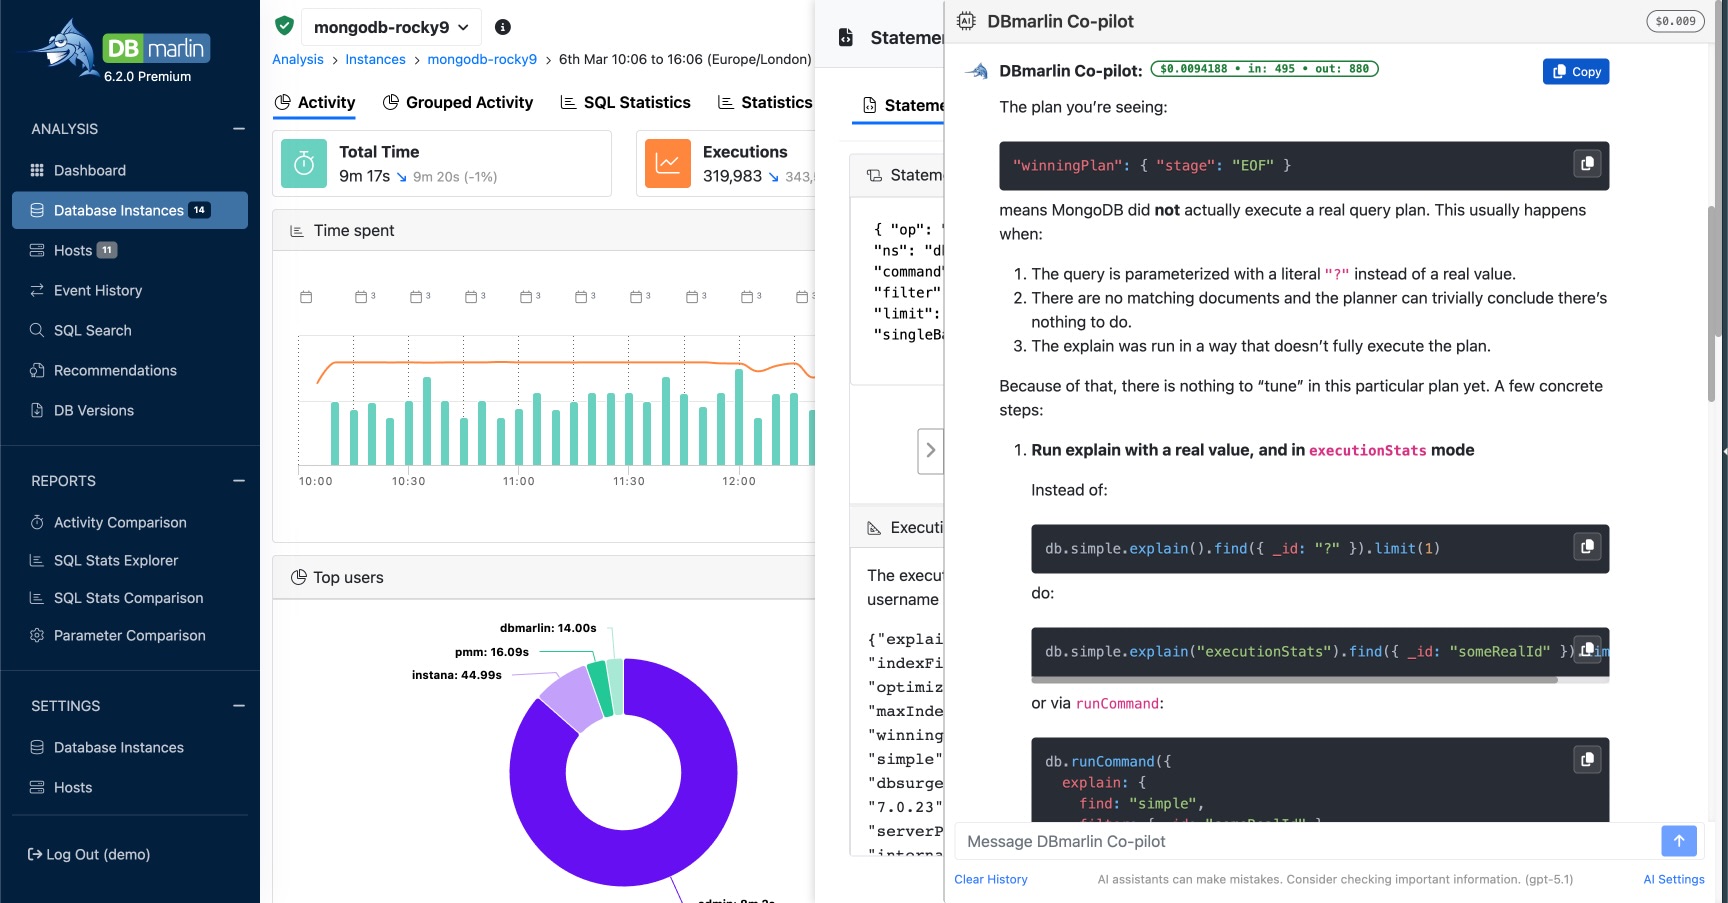
Automatic execution plan capture. DBmarlin collects execution plans continuously in the background. There is no need to run explain() manually or instrument your application. You can review whether indexes are being utilised properly and identify collection scans that ought to be index scans.
AI Co-pilot integration. The DBmarlin AI Co-pilot works with MongoDB the same way it does everywhere else in the product. Send any query or wait event to the Co-pilot and get back index recommendations, query rewrite suggestions, or configuration guidance. It is accessible from any screen with a single click.
Common MongoDB Issues This Helps With
Collection scans on growing data. Missing or misconfigured indexes force MongoDB to scan entire collections. Statement statistics and execution plan data make this obvious straight away, so you can create the right indexes before response times spiral.
Expensive aggregation pipelines. A multi-stage pipeline that burns through CPU needs targeted optimisation, and the first step is knowing which pipeline is the problem. DBmarlin ranks operations by resource cost so you know where to look.
Post-deployment regressions. DBmarlin integrates with Jenkins, Harness, Liquibase and more for CI/CD event tracking. Those integrations now cover MongoDB instances, so you can correlate deployments with performance changes the same way you do for relational databases.
Who Gets the Most Out of This
SREs, DevOps engineers, and platform teams managing mixed database estates will notice the biggest difference. Having MongoDB in the same dashboard as every other engine removes an entire category of tool-switching overhead.
For DBAs focused specifically on MongoDB, the depth of query-level statistics, execution plan capture, and AI-driven tuning advice goes well beyond what the native MongoDB monitoring tools provide. Get Started
DBmarlin 6.1 is available now. Existing users can add MongoDB as soon as they upgrade. New users can download a free trial, book a demo, or explore the live demo environment. Full details are in the release notes.
Frequently Asked Questions
Can DBmarlin monitor MongoDB and relational databases at the same time?
Yes. DBmarlin supports eleven database engines in a single platform, including Oracle, PostgreSQL, SQL Server, MySQL, MariaDB, IBM Db2, CockroachDB, Informix, SAP HANA, SAP ASE, and now MongoDB. All of them appear in one unified interface with the same monitoring workflow.
How does the DBmarlin AI Co-pilot work with MongoDB?
The AI Co-pilot analyses performance data collected from your MongoDB instance and returns tuning advice. That includes index recommendations, query rewrite suggestions, and configuration changes. You can send any query or wait event to the Co-pilot directly from the DBmarlin interface with a single click.
Want to try it out?
👉 Want to see how DBmarlin can help your organisation? Start your free trial today.