
A visual approach to understanding query execution plans

Demystify query execution plans with visual explanations to enhance performance tuning.
Structured Query Language (SQL) tells a database engine what data is required but not how to get it. It is up to the database optimiser to work out the best way. It cannot take too long deciding before it itself affects performance. This is both a strength and a weakness of SQL. Mostly the optimiser makes the best choice; occasionally it gets it wrong. You can see the approach taken by the optimiser in the query execution plan that it creates.
Query execution plans are one of the most direct windows into how a database engine runs your SQL. They expose how the optimiser breaks down your query, what operations it performs, and in what order. If you want to understand why a query is slow or how to improve it, the execution plan is the first place to look.
Still, many teams avoid working with them. Not because execution plans aren’t useful, but because the default ways to access and read them are clunky, inconsistent, or hard to interpret.
DBmarlin helps by automatically collecting execution plans and showing them in a visual, interactive format, making it easier to see what changed, where time is spent, and which parts of a query need attention. Not only that but you can use the AI Co-pilot to analyse the execution plan for you and make recommendations on how to optimise the query.
What an execution plan actually tells you
When a query runs, the database engine decides how to get the data you asked for. That involves parsing the SQL, optimising the logic, and selecting from multiple strategies for scanning, joining, sorting, filtering, and more.
The execution plan shows the path the database chose. That includes:
- Which indexes were used (or skipped)
- Whether a table scan or index seek was performed
- How tables were joined and in what order
- The overall cost assigned by the optimiser
- Where most of the time or resources were spent
This kind of detail is critical when diagnosing poor performance, particularly for complex queries or those that suddenly slow down after a deployment or data volume change.
The challenge with raw plans
Every major database system has a way to generate execution plans, PostgreSQL with EXPLAIN (ANALYZE), SQL Server with estimated or actual plans, Oracle with DBMS_XPLAN, and so on. But these outputs are usually dense blocks of text or overly busy graphical representations that assume you already know what every symbol and keyword means.
Even experienced developers and DBAs can find it difficult to compare plans side by side or understand subtle changes when flipping between tools or environments.
How DBmarlin helps
DBmarlin automatically captures execution plans from supported databases without requiring manual exports. It obtains the plans near to the time the SQL was executed which is important, since plans can change over time and running EXPLAIN for a statement later, might give a different plan to the one which was actually used at the time of execution.
It then displays those plans in a clean, visual format that’s easier to understand at a glance.
The interface shows :
- SQL text right next to the plan itself
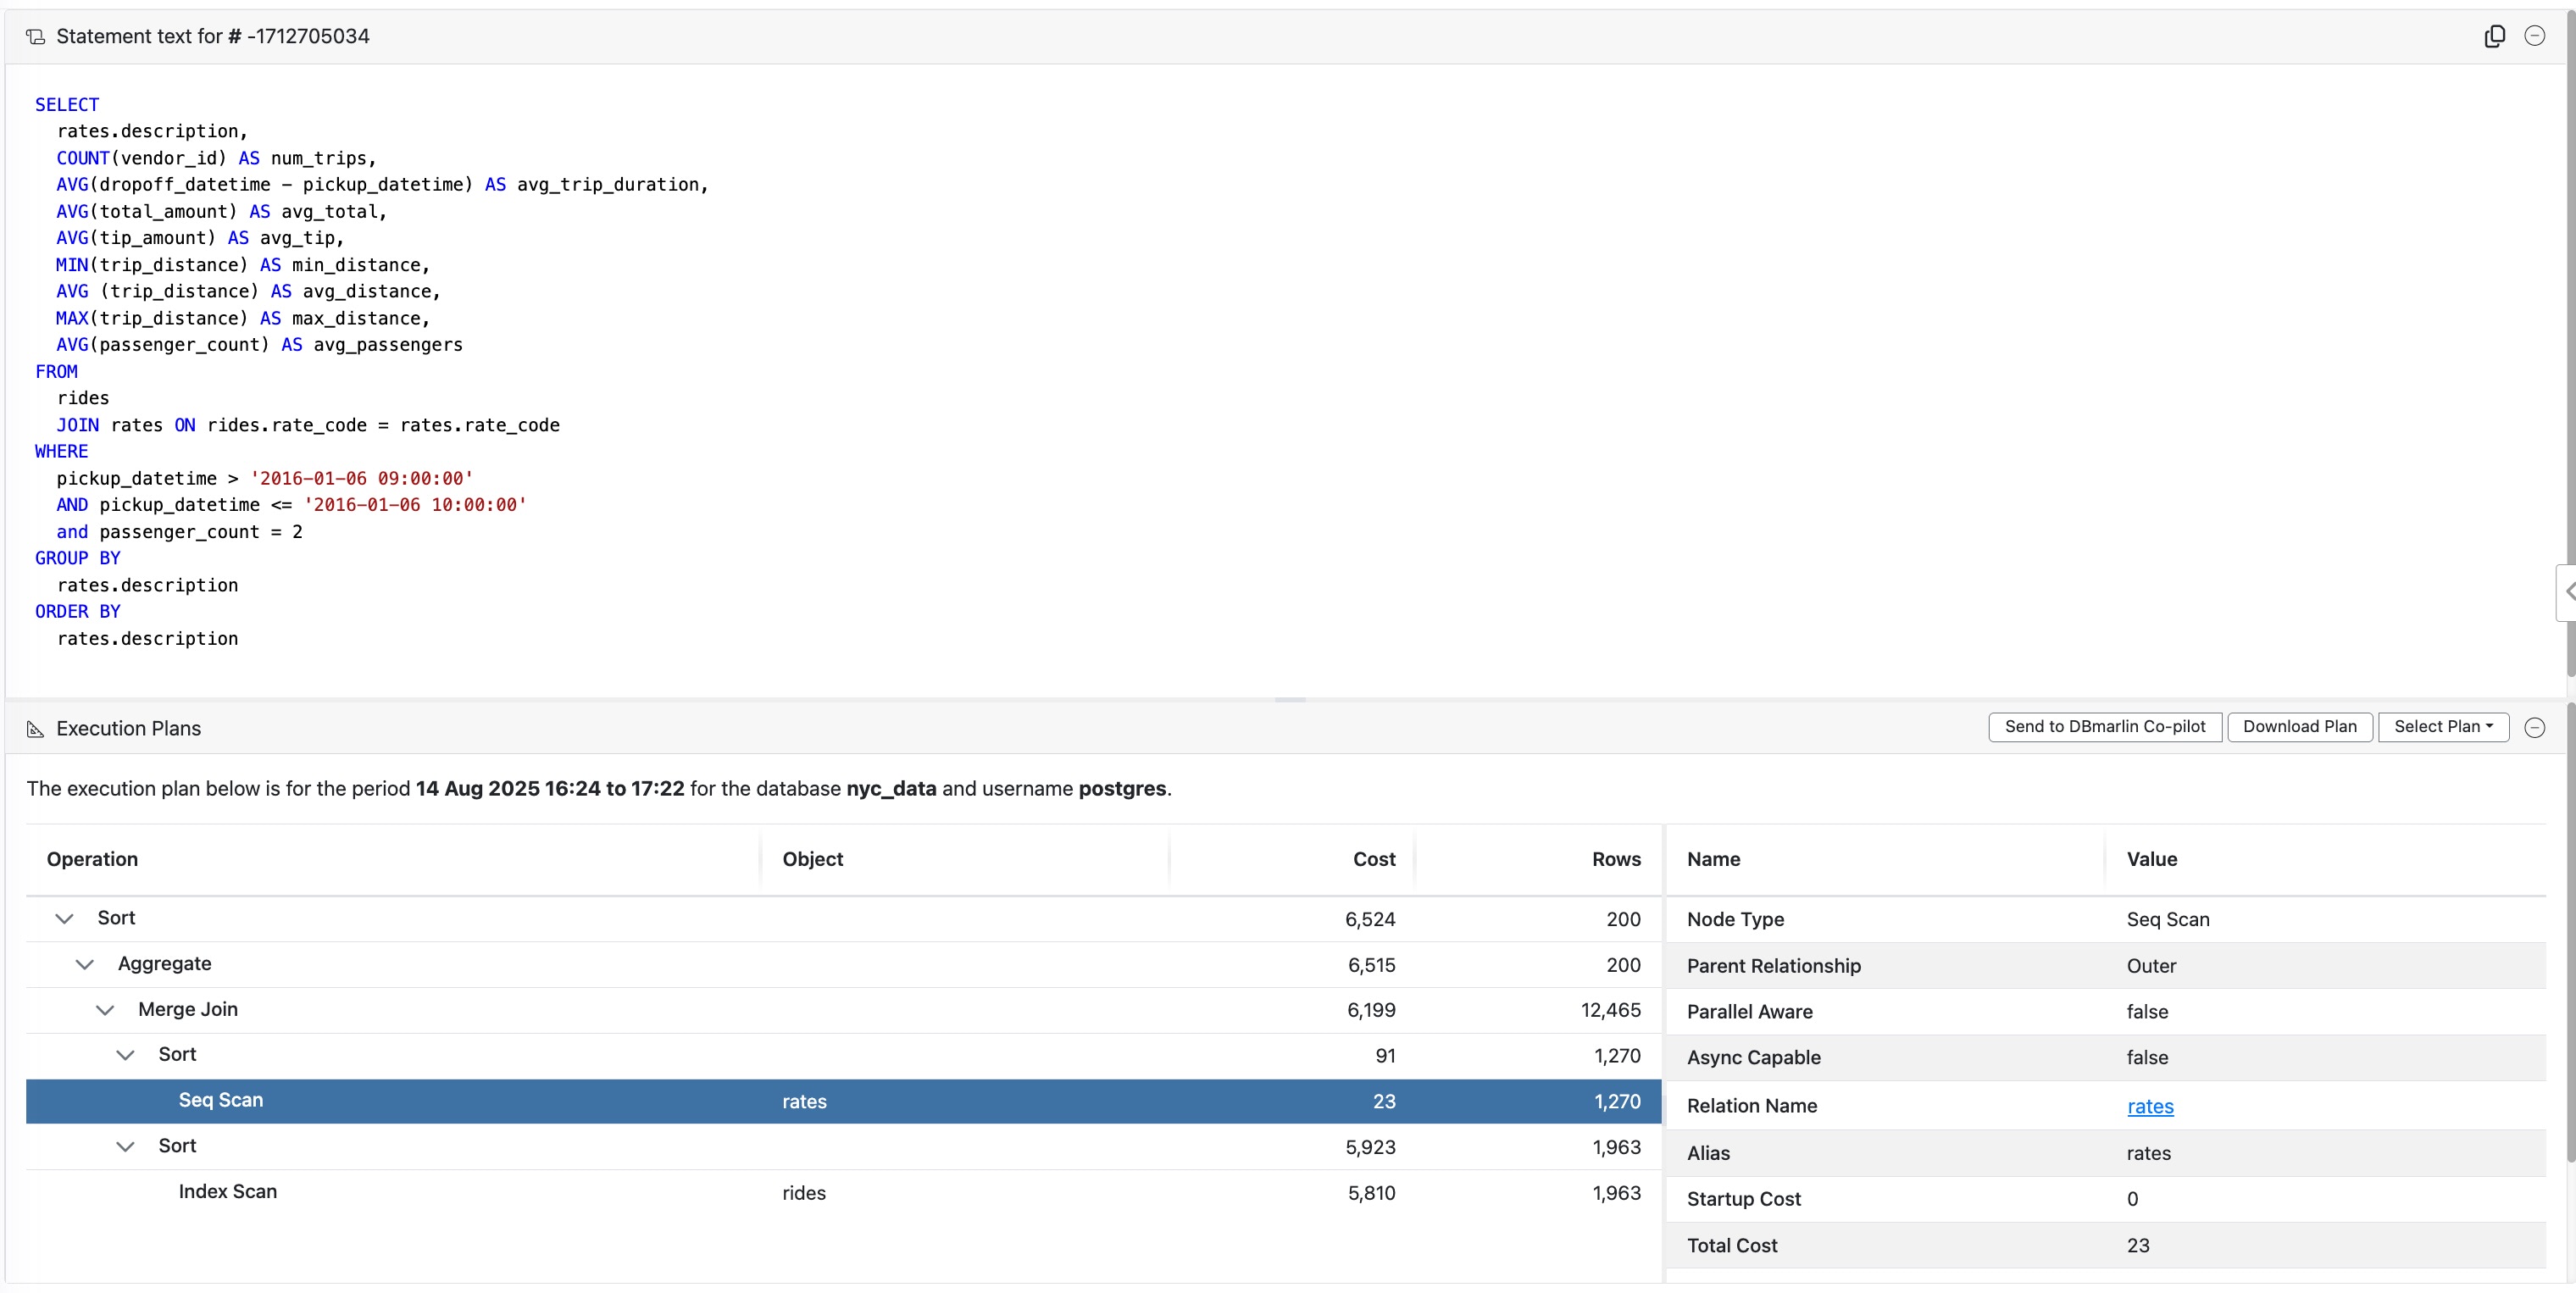
- A clear visual tree or flow map showing the order and cost of the operations performed
- Highlighted cost values and rows processed
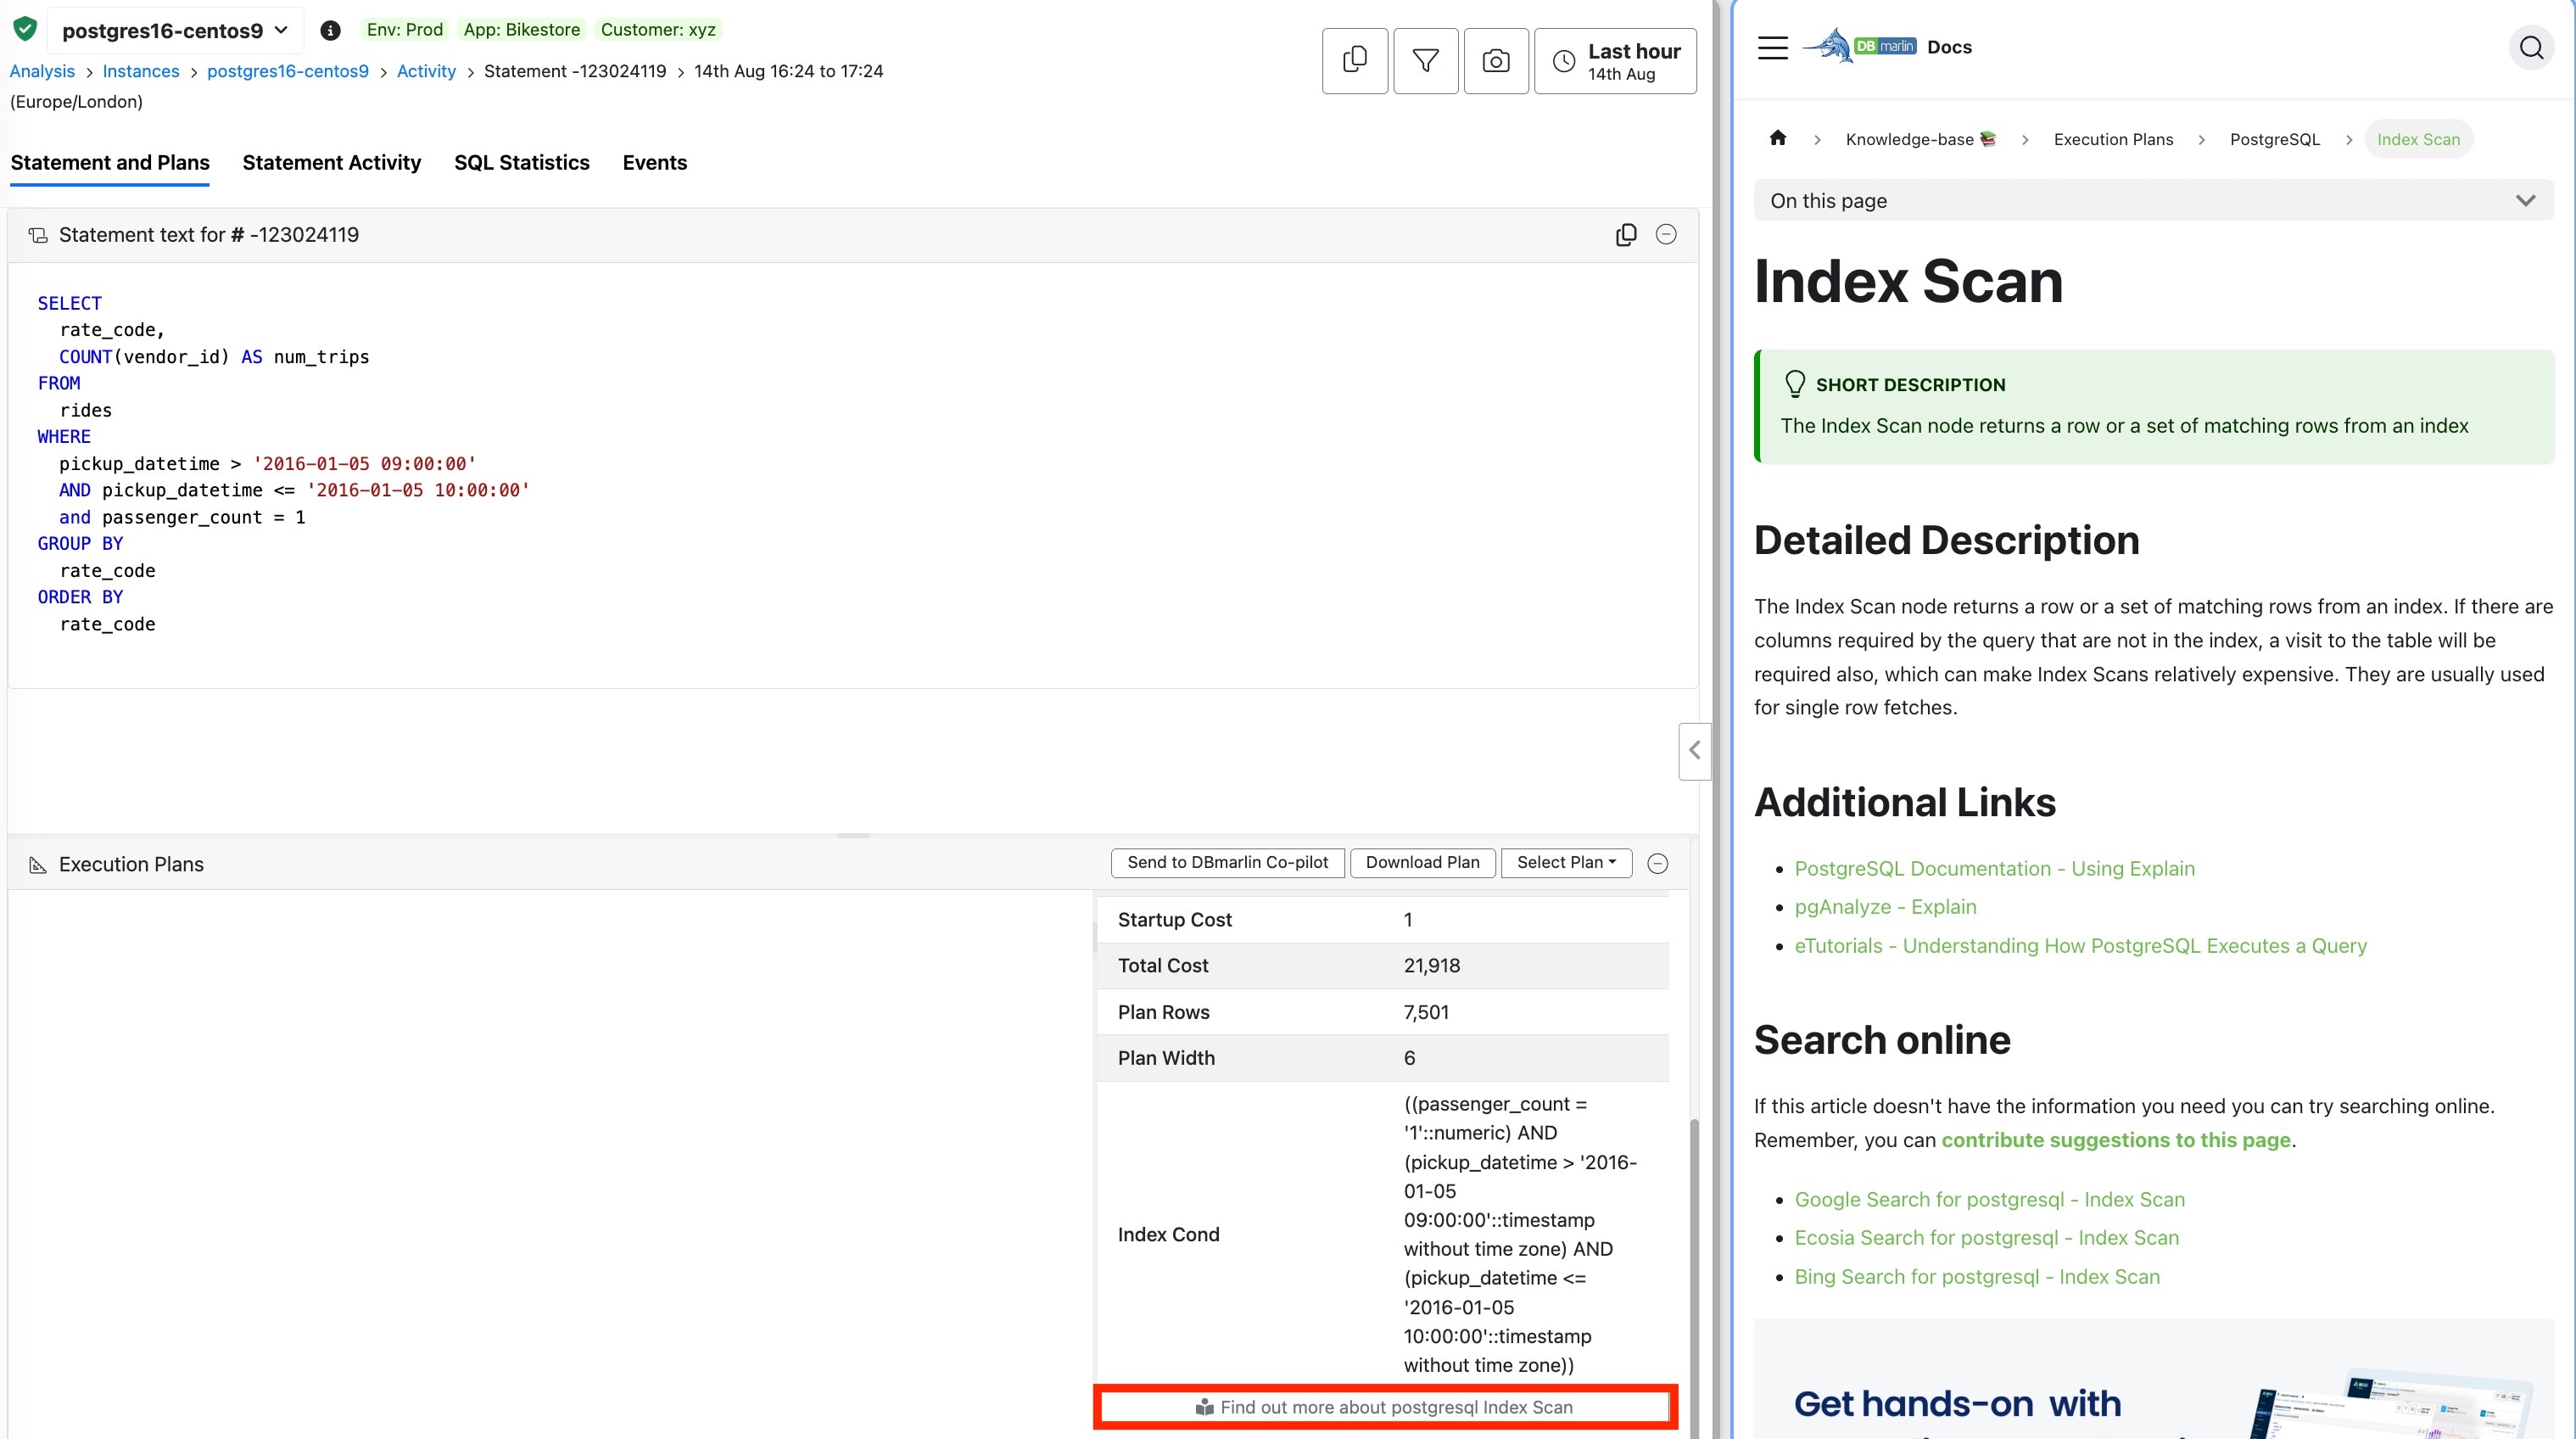
- For explanation of operations like explain join types, scan methods, and other terms there is a link to a built-in knowledge base.
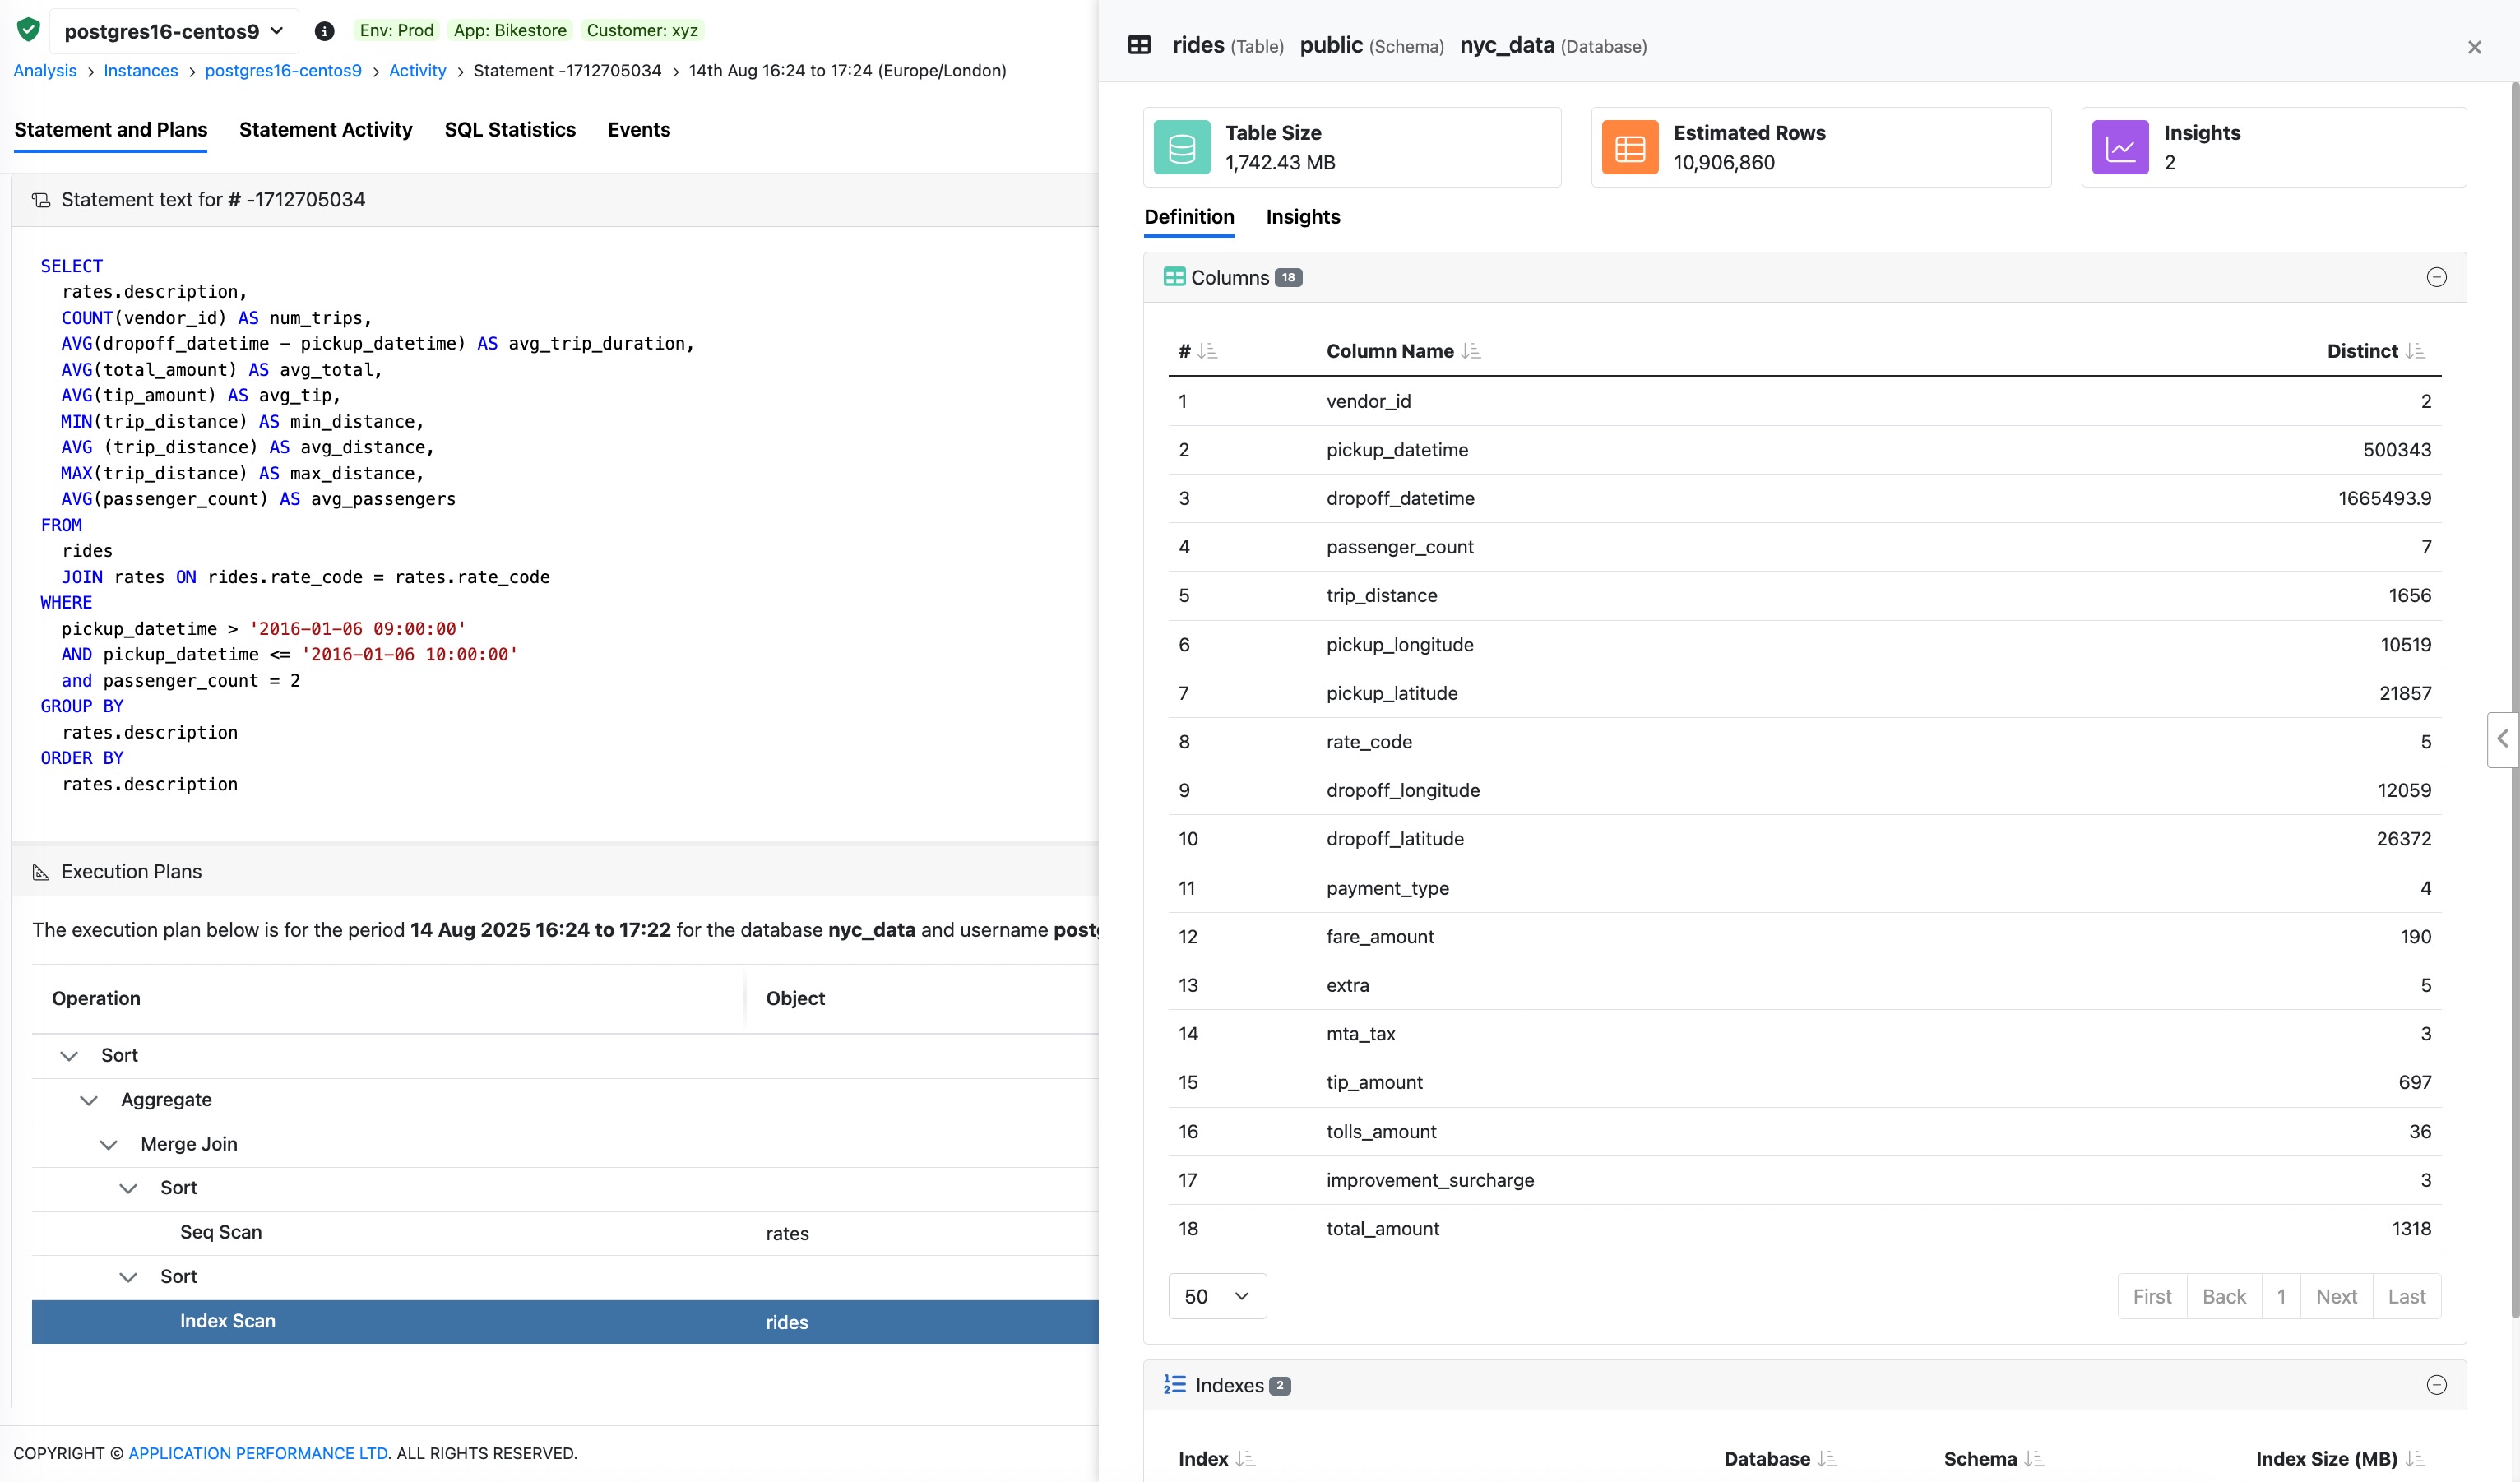
- For a table or index access you can click on the object name to see the object statistics such as size, number of rows or distinct values.
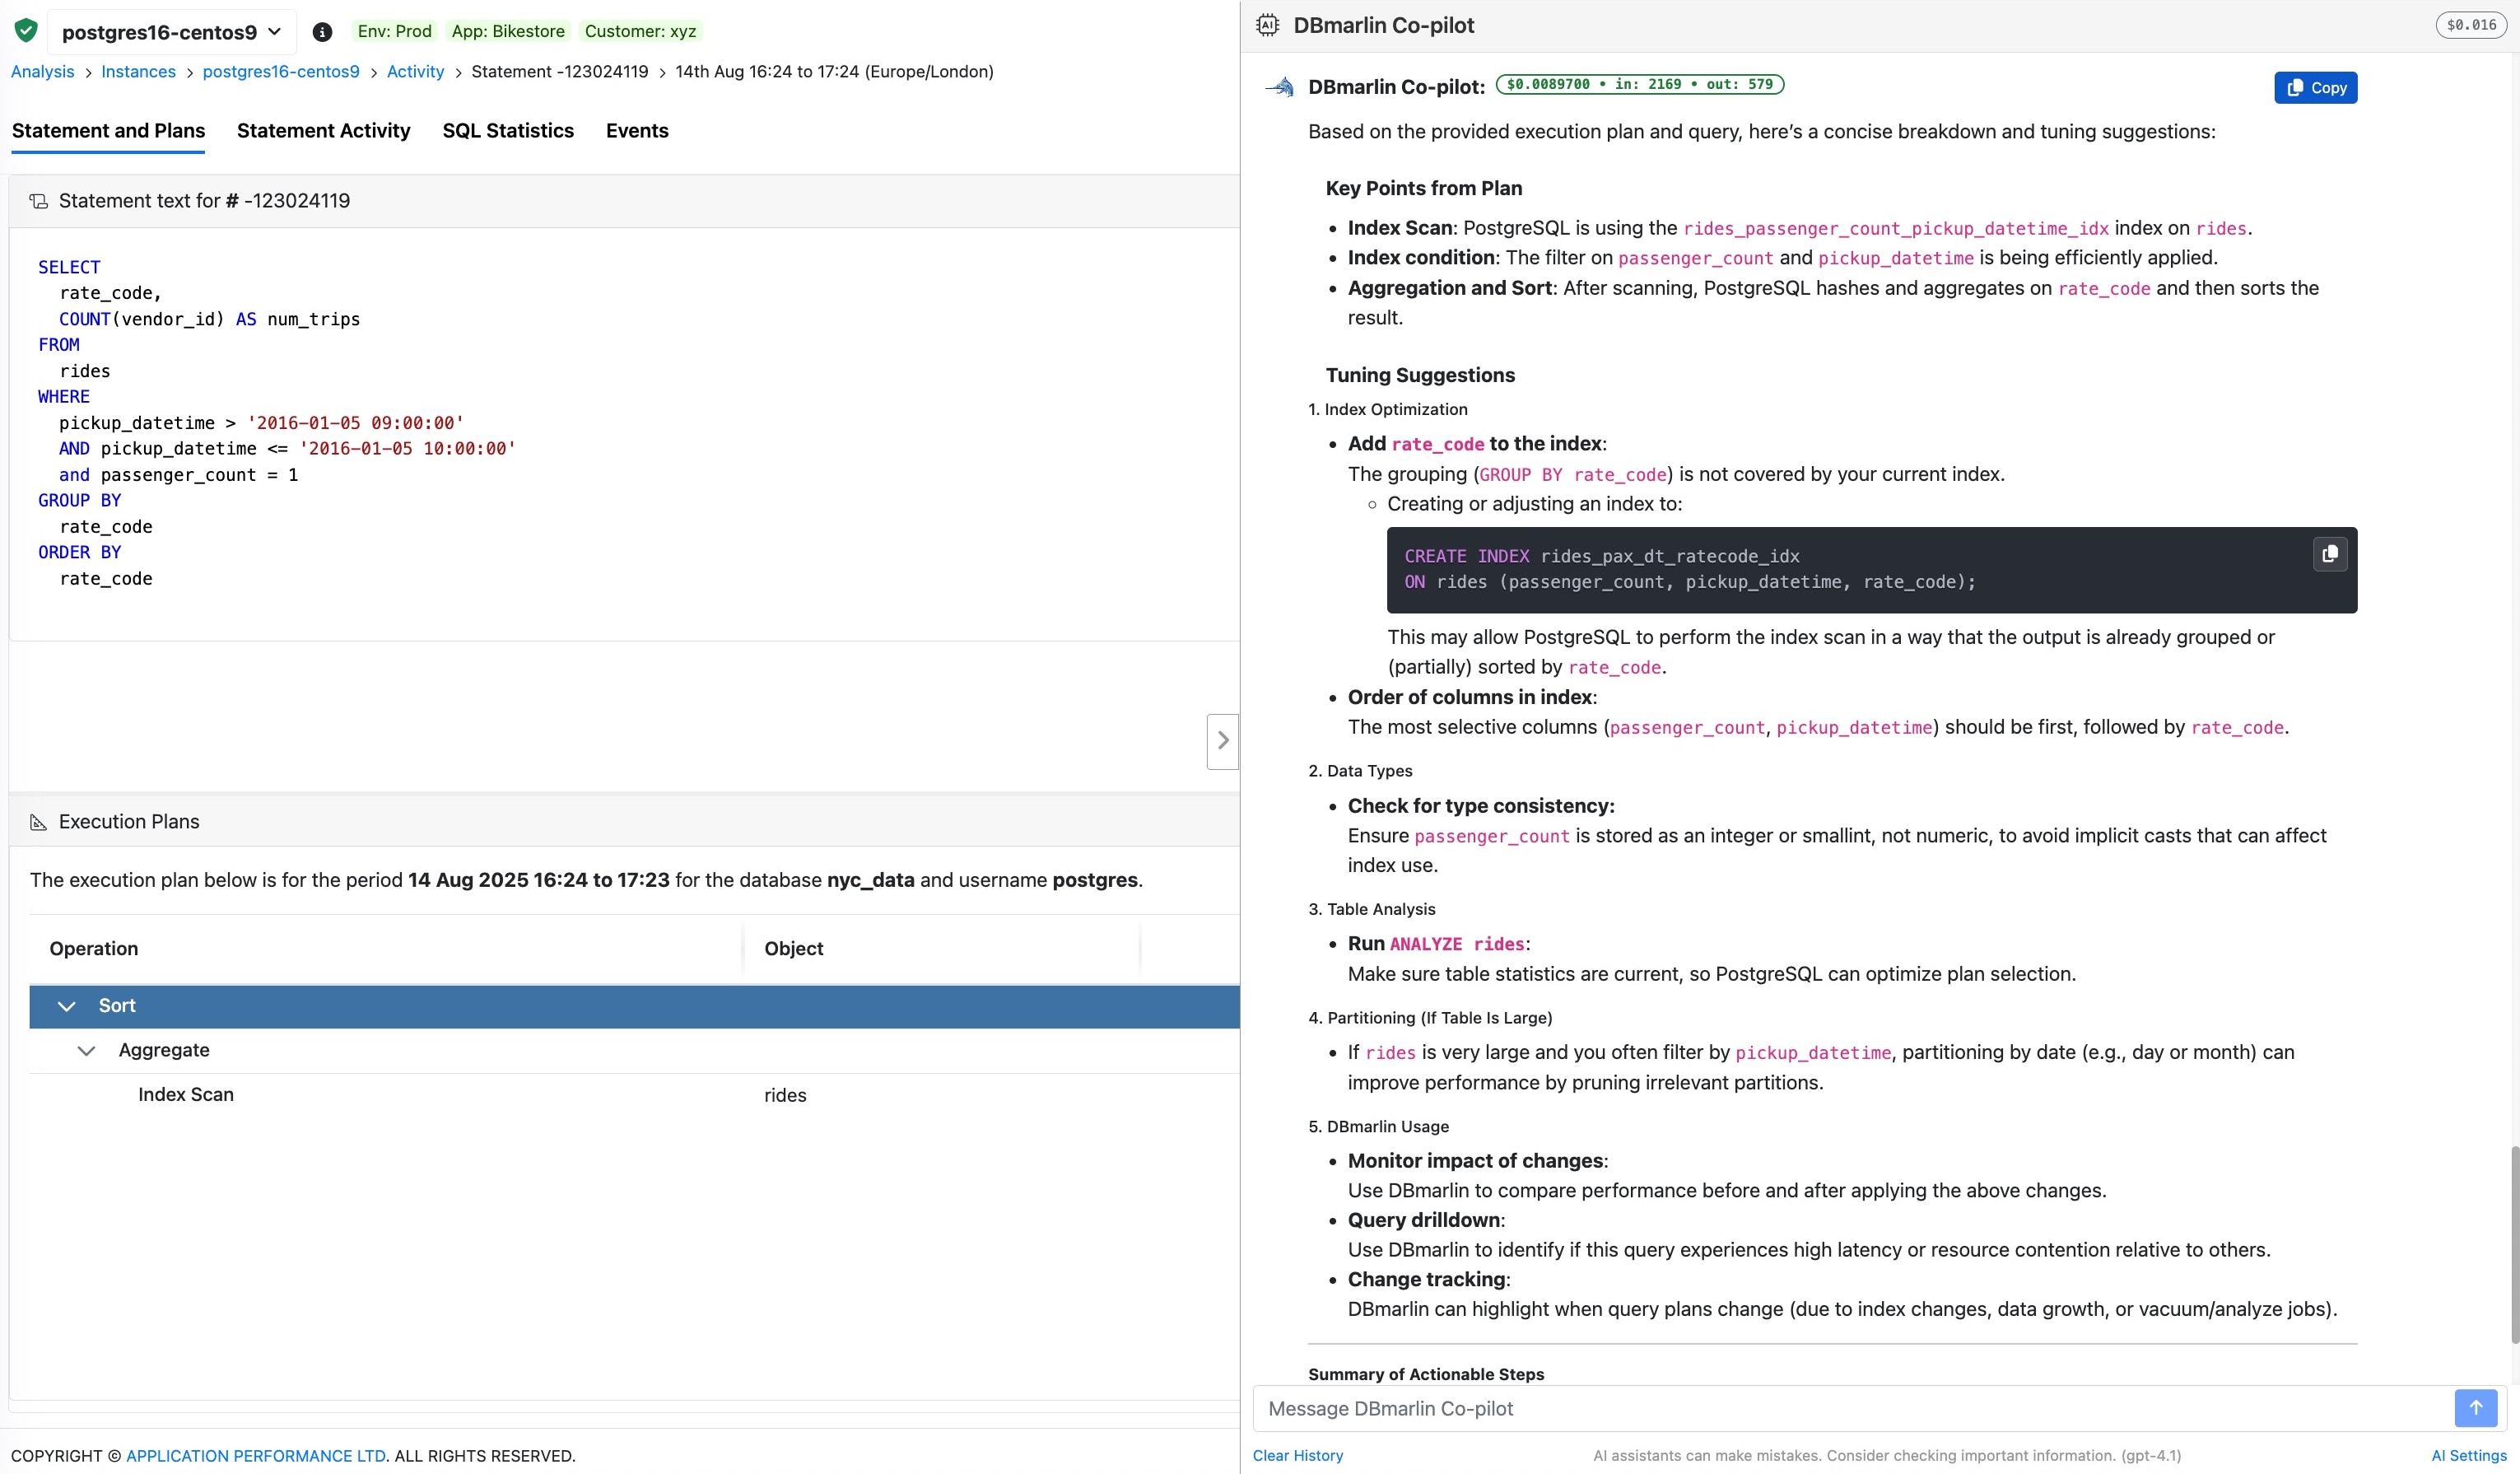
- You can also send the execution plan to the built-in AI Co-pilot with a single click to get a clear explanation of it and recommendations about how it could be opimitised.
This lets you go beyond “query A was slow” to “query A ran differently, and here’s exactly why and what can be done to fix it.” And because it’s tied into DBmarlin’s timeline, you can correlate plan changes with changes such as code deployments or schema changes.
Use cases that matter
Diagnosing regressions:
If a query that used to run quickly suddenly slows down, DBmarlin helps you compare the previous plan with the current one. Maybe a different join strategy was used. Maybe a filter no longer qualifies for an index. These changes are often invisible if you’re only looking at query durations.
Validating optimisations:
After changing indexes, rewriting a query, or adjusting parameters, you can immediately see how the plan changed. This helps confirm whether your fix is working or if the database engine still chooses an inefficient path.
Educating and debugging as a team:
Visual plans make it easier to talk through performance with developers, DBAs, or SREs who aren’t deep database experts. Instead of walking through a wall of text, you can point to specific plan operations and row counts and have a productive conversation about where to focus tuning efforts.
Honest limitations
DBmarlin does not collect plans for every single query by default. It focuses on the most resource-intensive queries and long-running statements. This helps avoid unnecessary overhead and keeps the collected data useful and manageable.
You still need to know what you’re looking at. DBmarlin helps by making the plans easier to read and by lining them up with the timeline of what changed.
At the end of the day
Execution plans aren’t just for DBAs or database tuning specialists. They’re for anyone trying to understand why a query behaves the way it does. With better visibility and clearer comparisons, teams can spend less time guessing and more time making informed decisions. Being able to spot a change in plan before it turns into a real problem is the kind of context most teams wish they had sooner.
Want to try it out?
Getting started takes minutes. Head over to dbmarlin.com to get started.