DBmarlin 5.7.0 now available with new dashboard
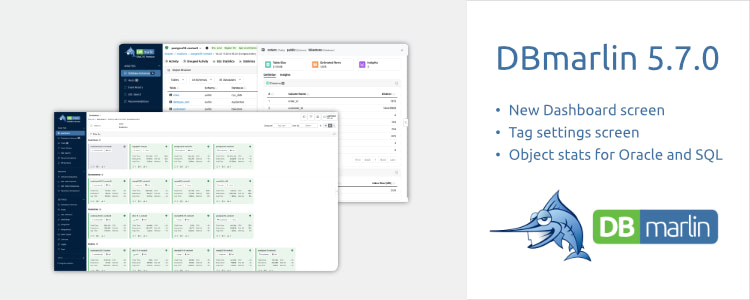
We’re excited to announce the release of DBmarlin 5.7, which introduces a new top-level Dashboard for visualising your database estate in powerful new ways. This release also includes a new Tag Settings screen, making it easier to manage and apply tags across instances. Additionally, we’ve extended Object Statistics support to both SQL Server and Oracle.
🔍 Dashboard screen
The Dashboard screen is a new top level screen in DBmarlin which lets you view your database estate in new and interesting ways.
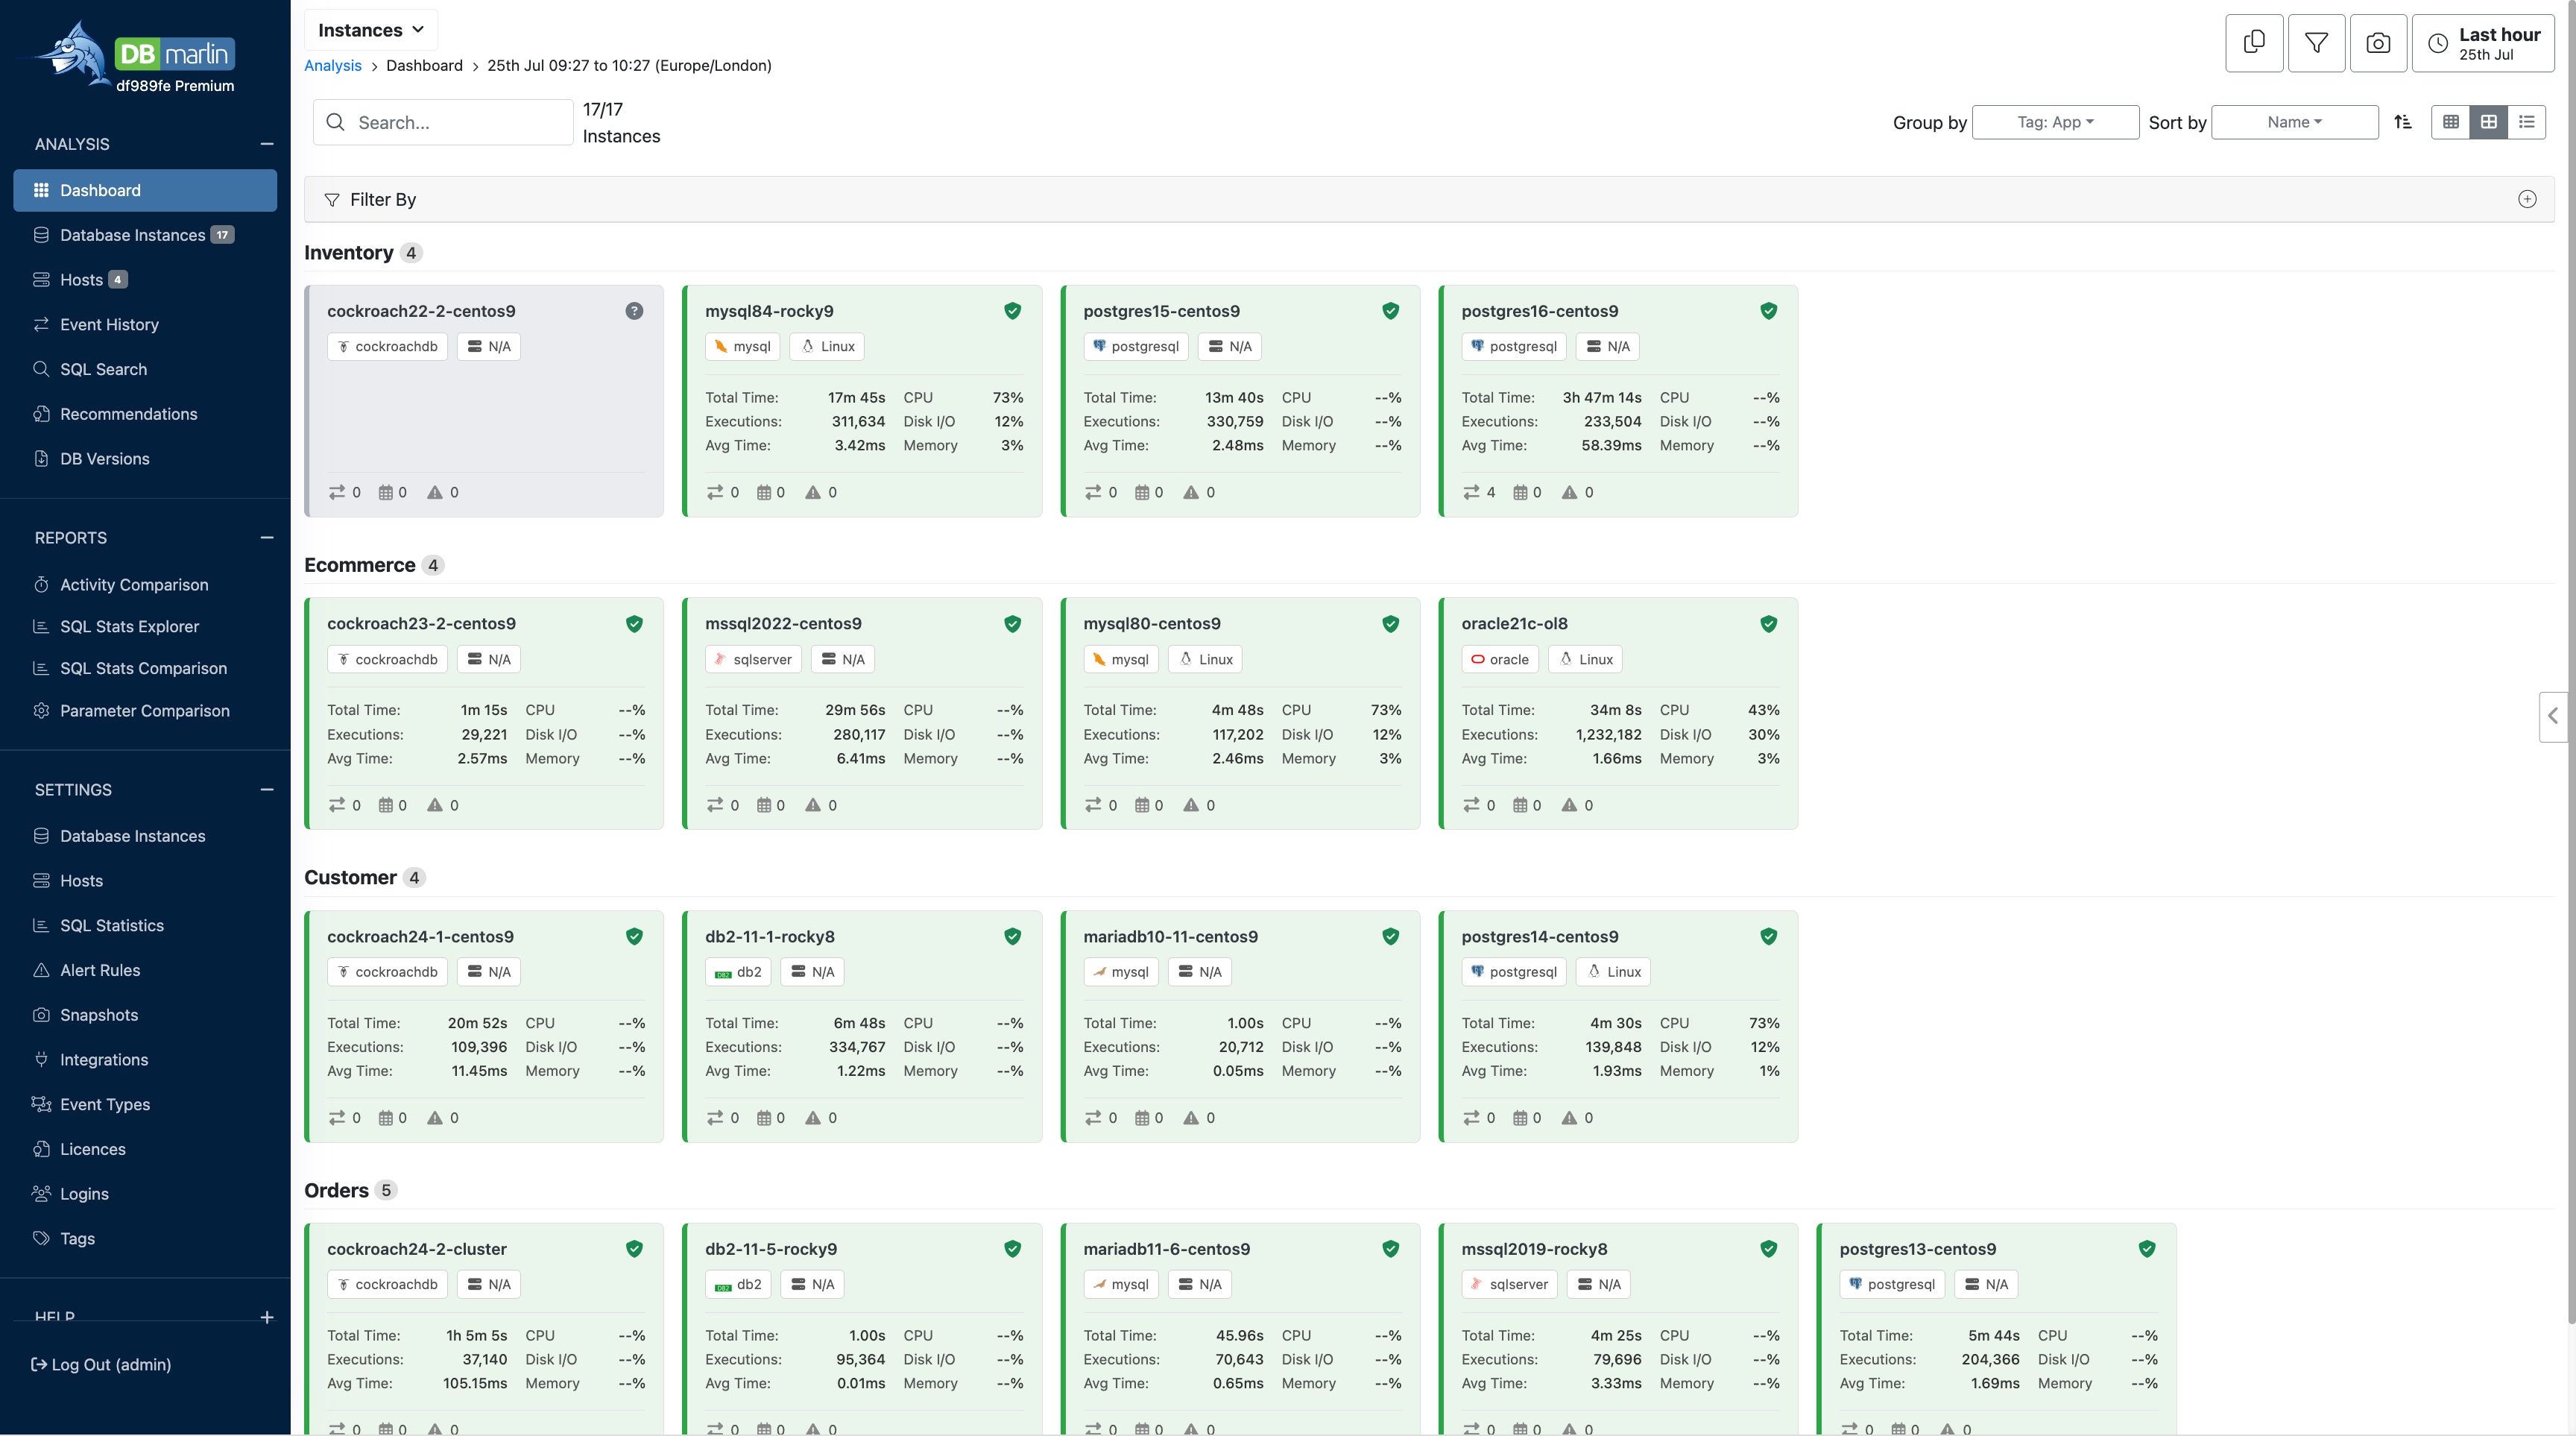
You can now switch between large tiles, small tiles, or a tabular view—depending on how many instances you want to fit on the screen and how much detail you need to see for each.
At the top of the screen, you’ll find Filter by, Group by, and Sort by options, allowing you to control which instances are visible and how they’re organised.
You can filter or group by built-in attributes like DB Type, Host, Host Type, or Sensor Status, as well as by events such as Alerts, Changes, or Custom Events. You can also use any tags you’ve applied—for example, tags like app, env, service, customer, region, cluster, or owner—to tailor the view to your needs.
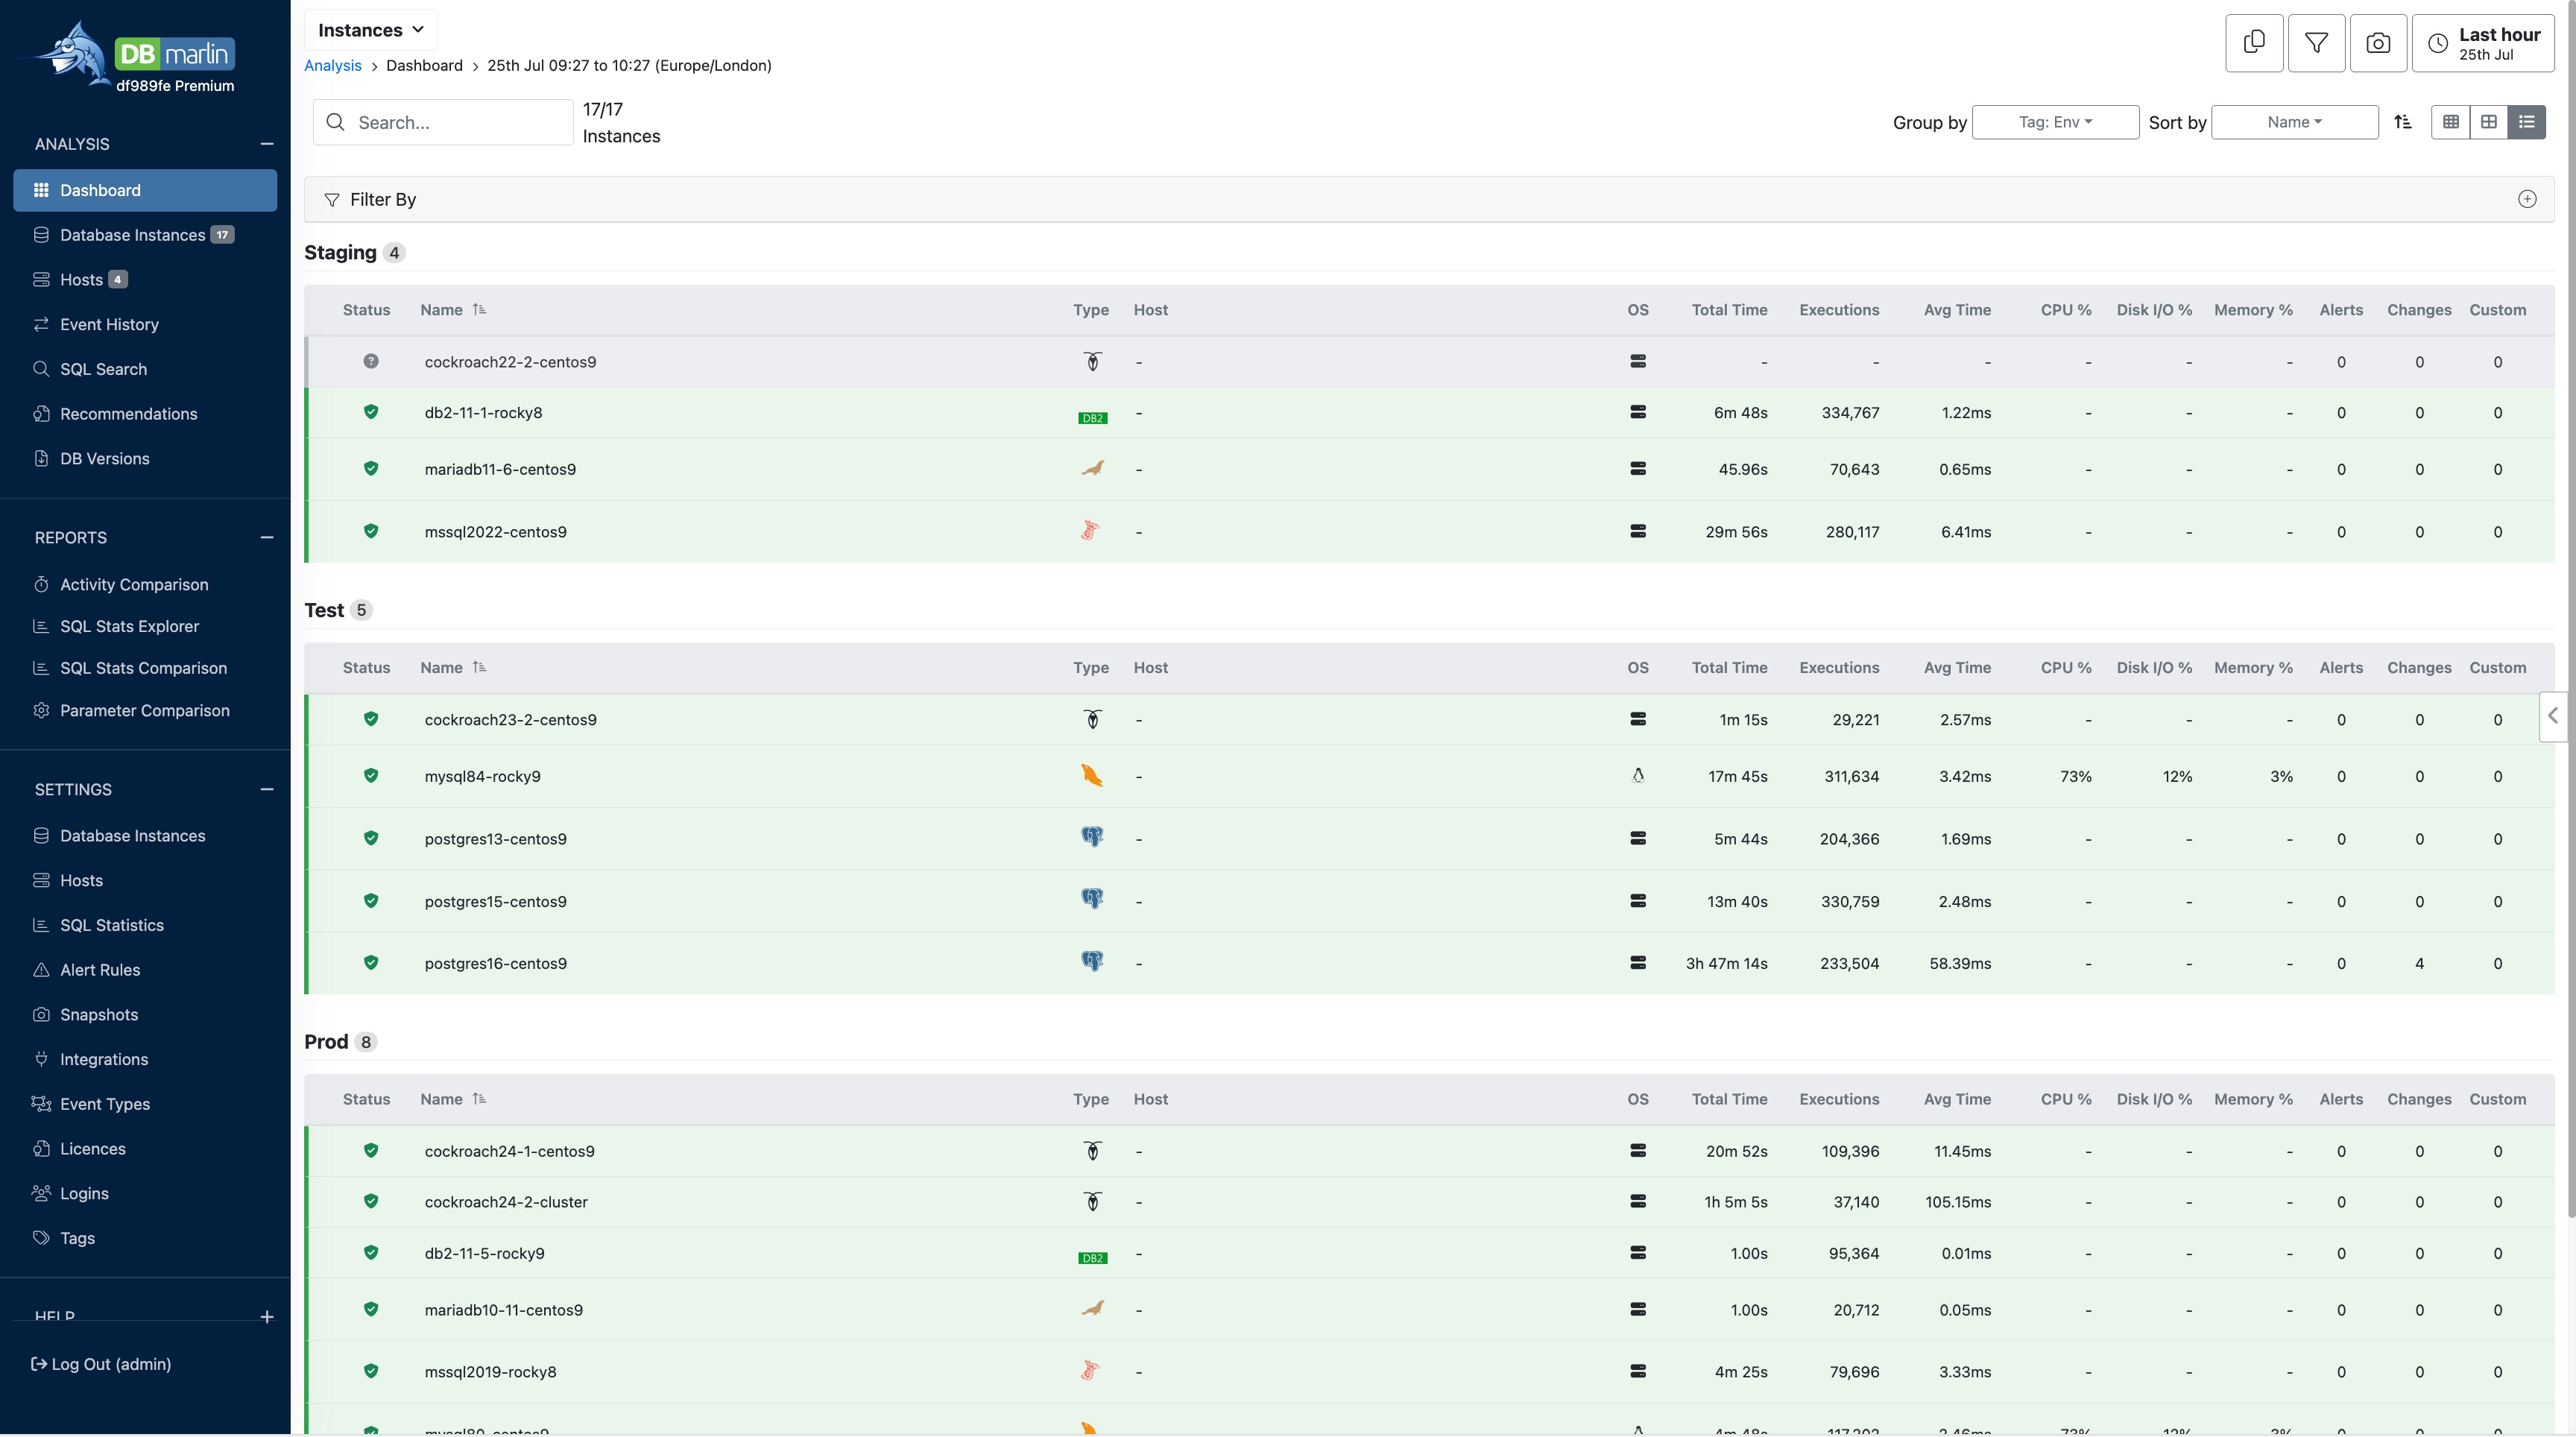
From the dashboard you can click on any instance to see a slide out panel with an overview of its performance. Or you can click on the group to see performance of a group of instances. For example if you are grouped by env and then click on the prod group you would see performance for all instances tagged with env=prod.
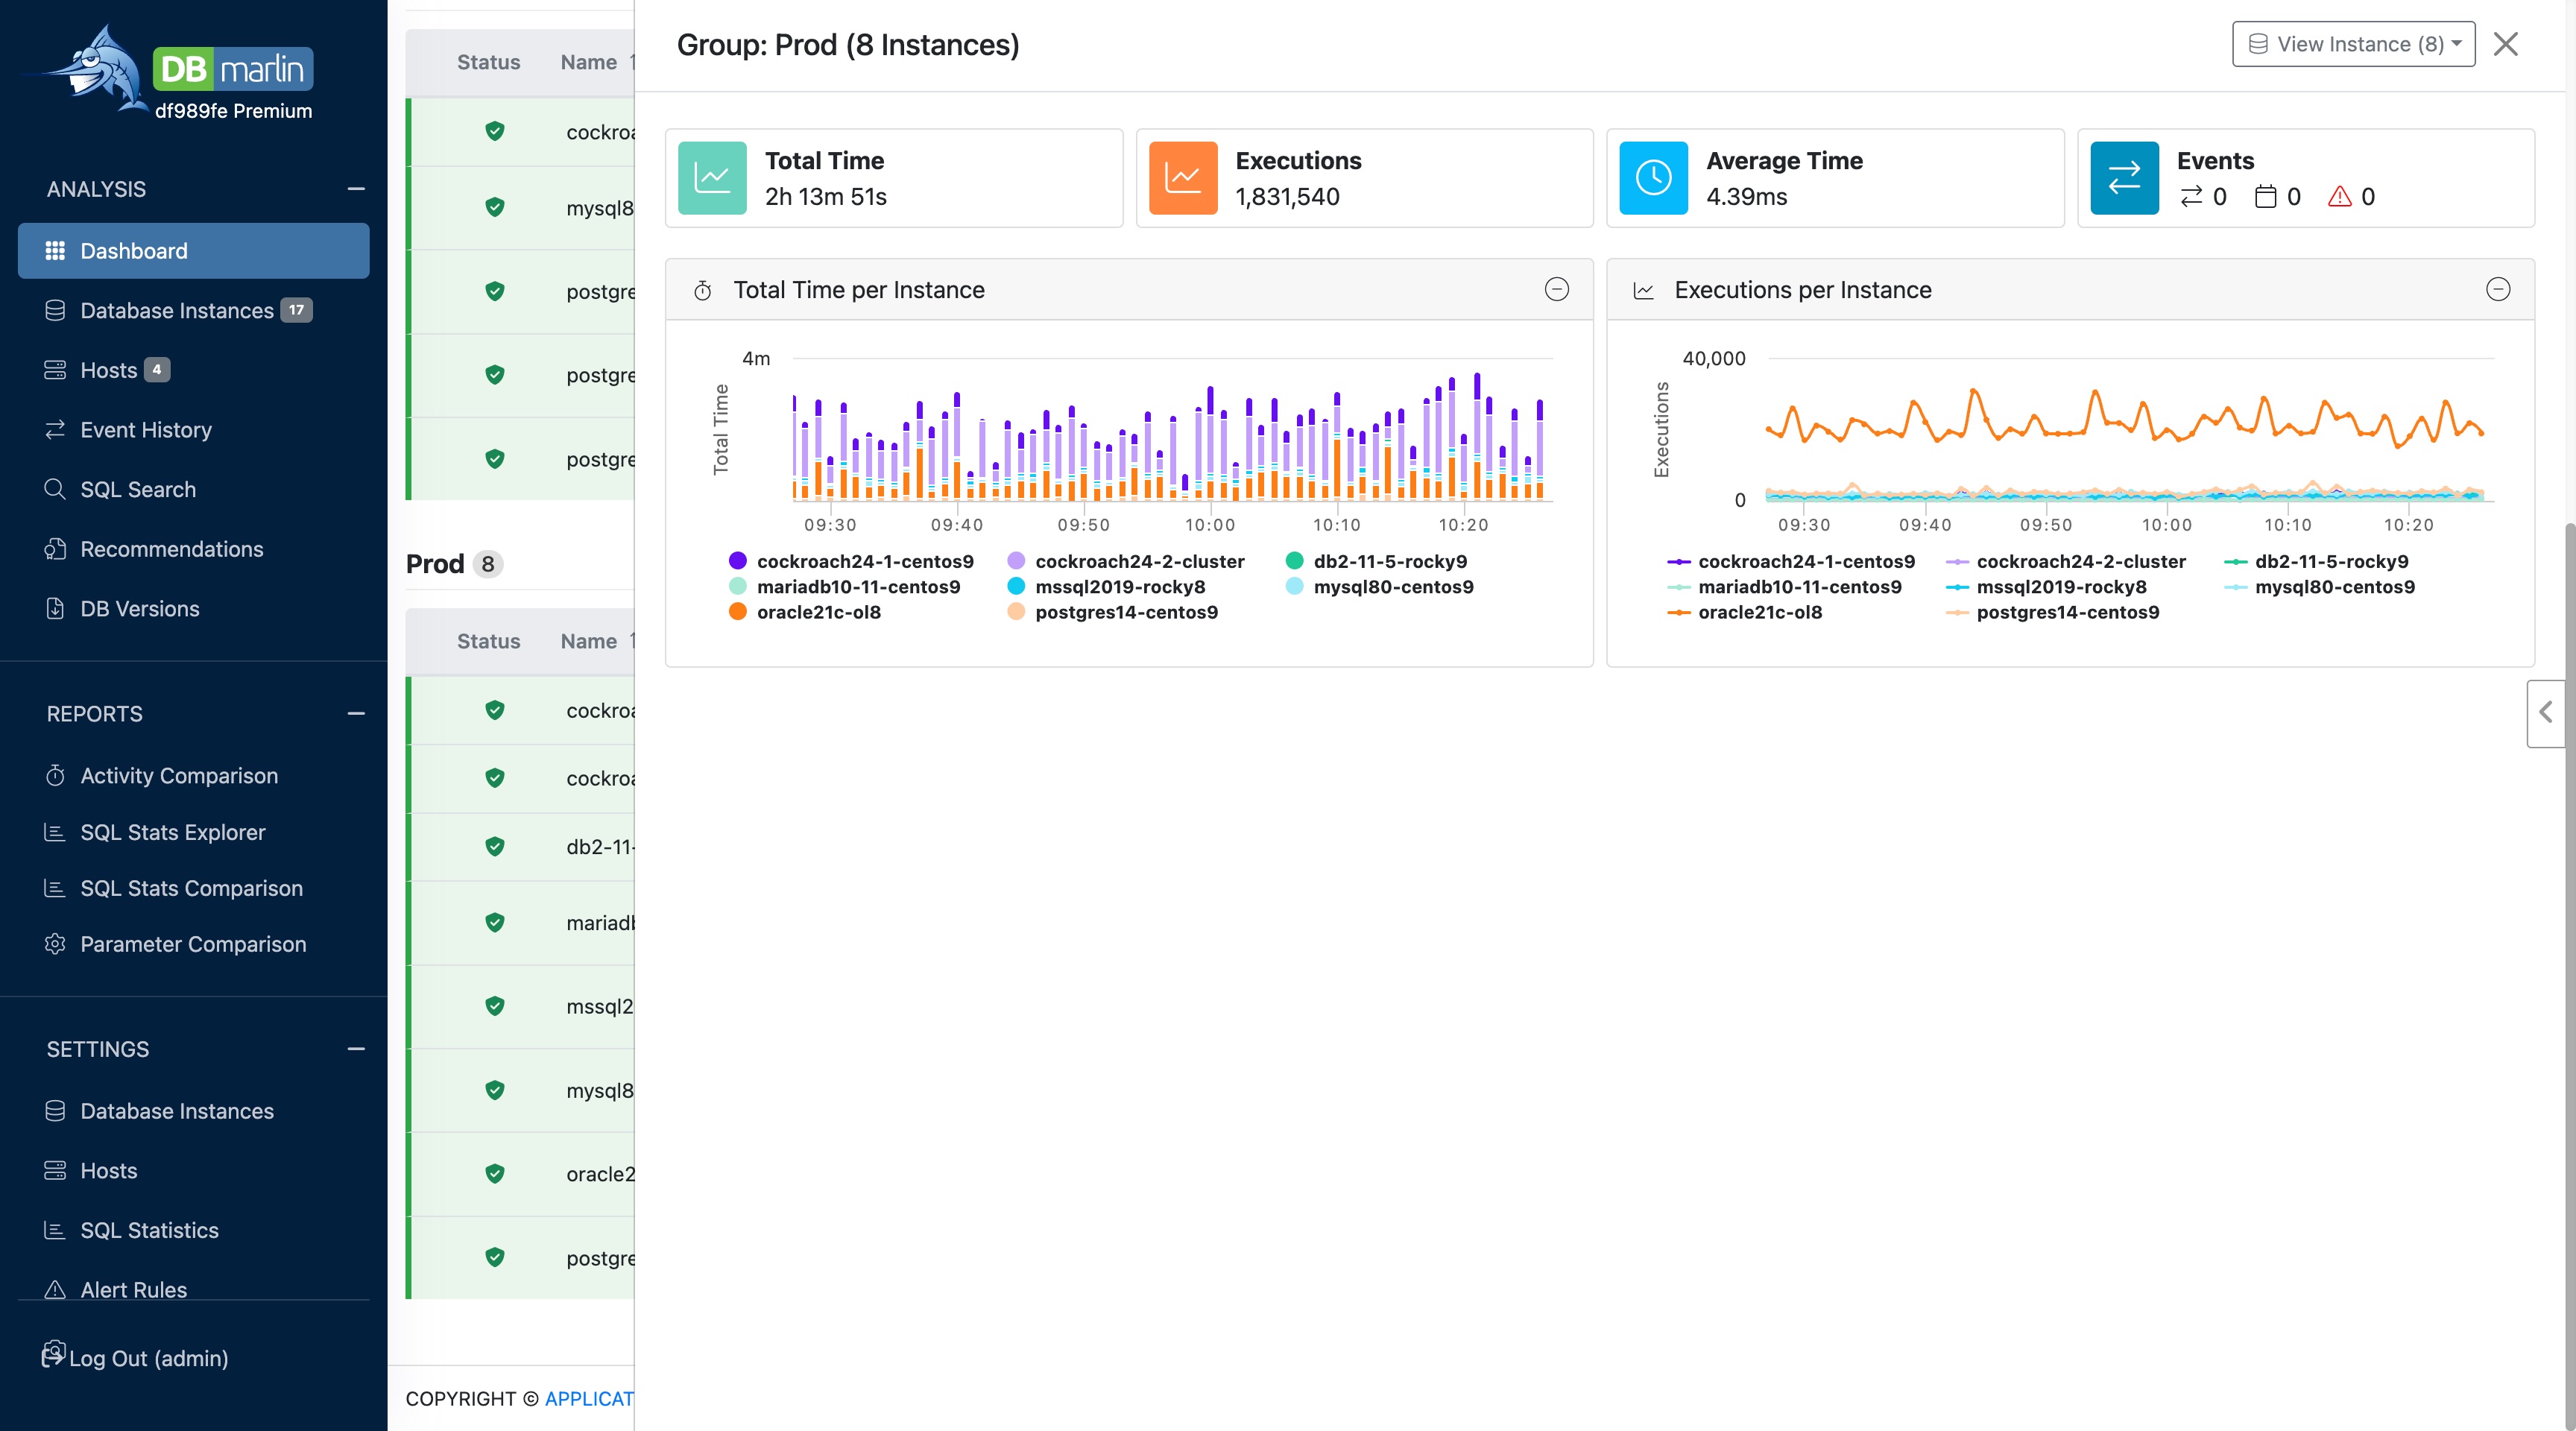
From the slide-out panel you can then use the button in the top right to navigate to the instance analysis screens.
🔍 Tag Settings
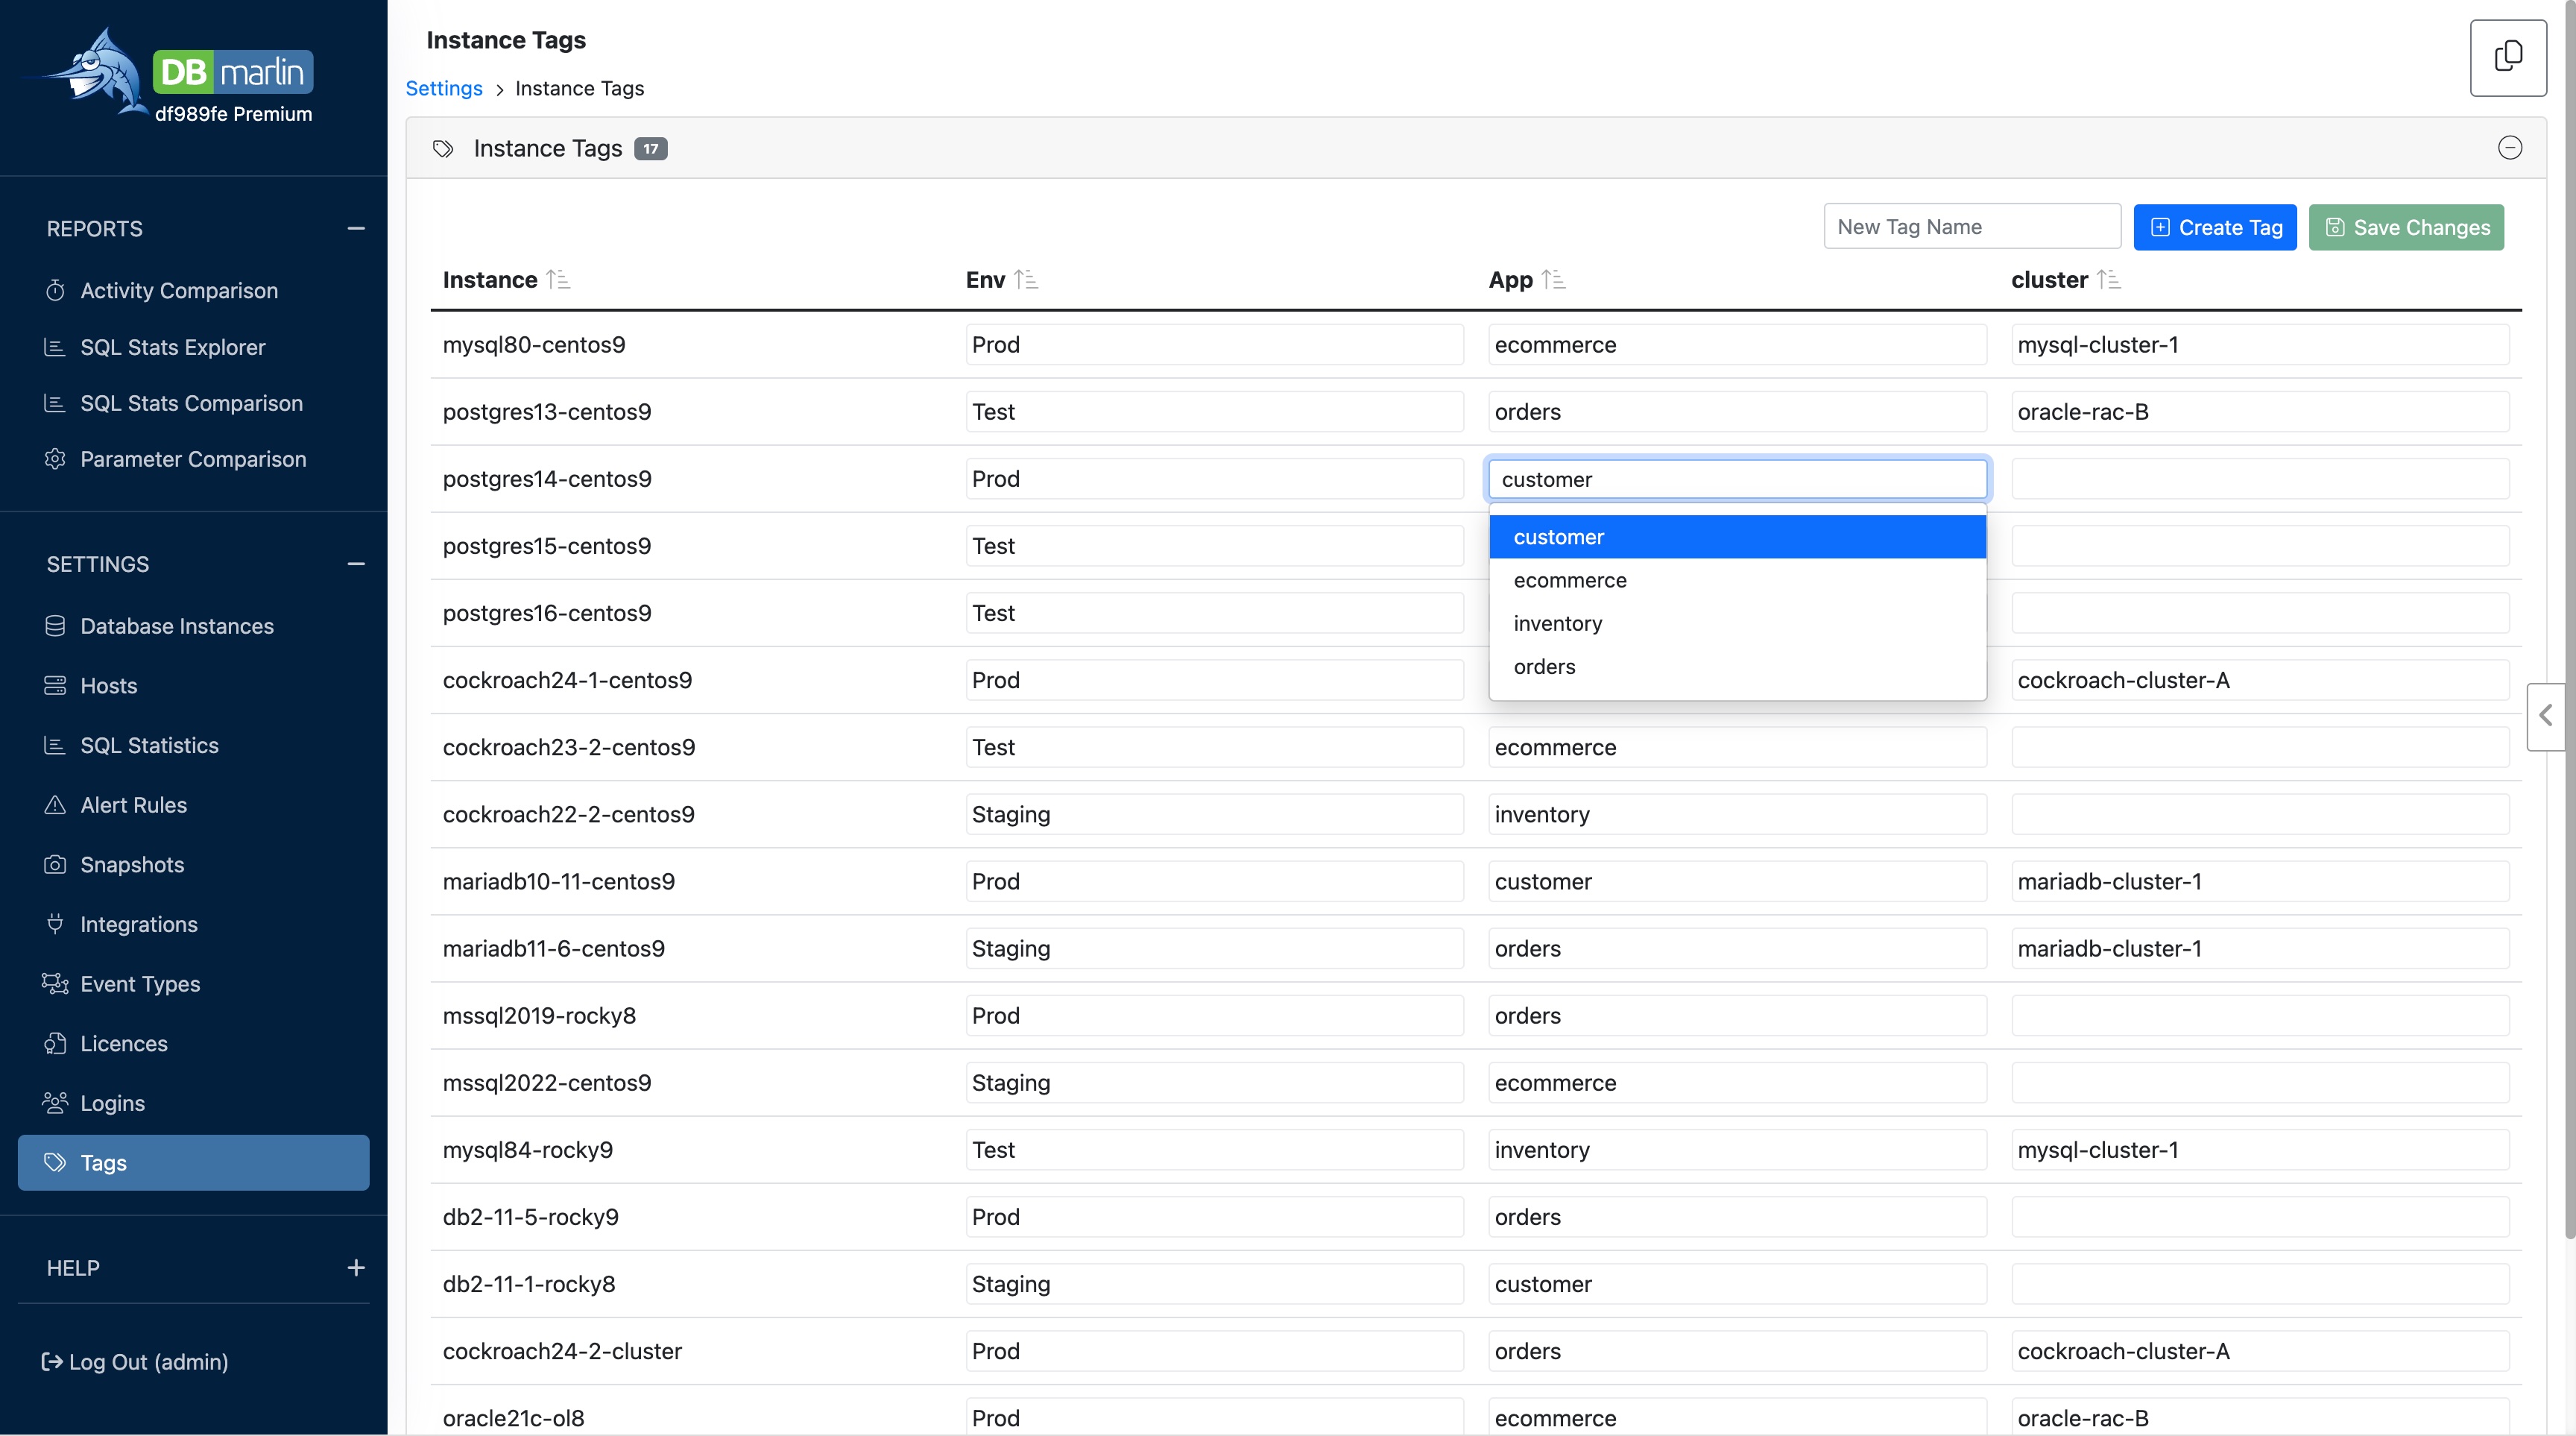
We’ve added a new Settings screen to make it easier to manage tags across all your instances in one place. Previously, tags had to be set individually for each instance, which was time-consuming. Now, you get a grid view showing all your tags and their values across instances. Updating tags is as simple as clicking a cell, selecting from existing values, or typing a new one. When you hit Save, all changes are applied at once, streamlining tag management significantly.
🔍 Object statistics for SQL Server and Oracle
Last month we added the Object Browser screen where you can view details for tables, indexes, and columns—including key statistics. This was available for MySQL, MariaDB and PostgreSQL initially but with 5.7 we extend support for SQL Server and Oracle too.
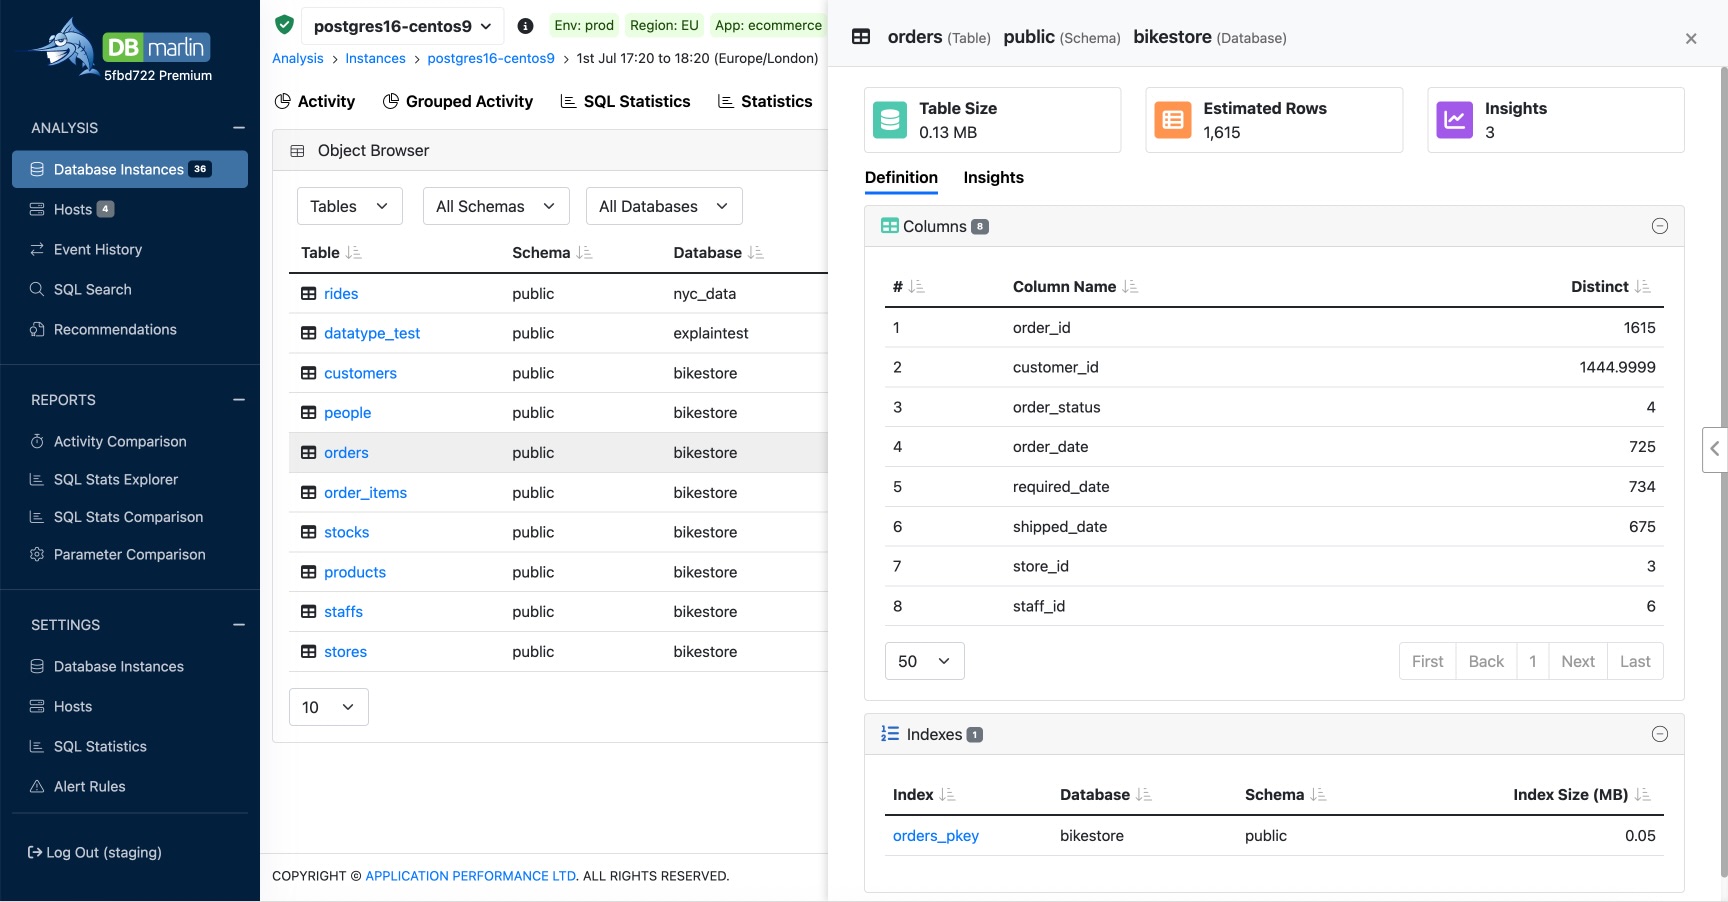
The Insights tab also provides information on things like
- Unused indexes
- Tables with missing Primary key
- Foreign key columns without an index
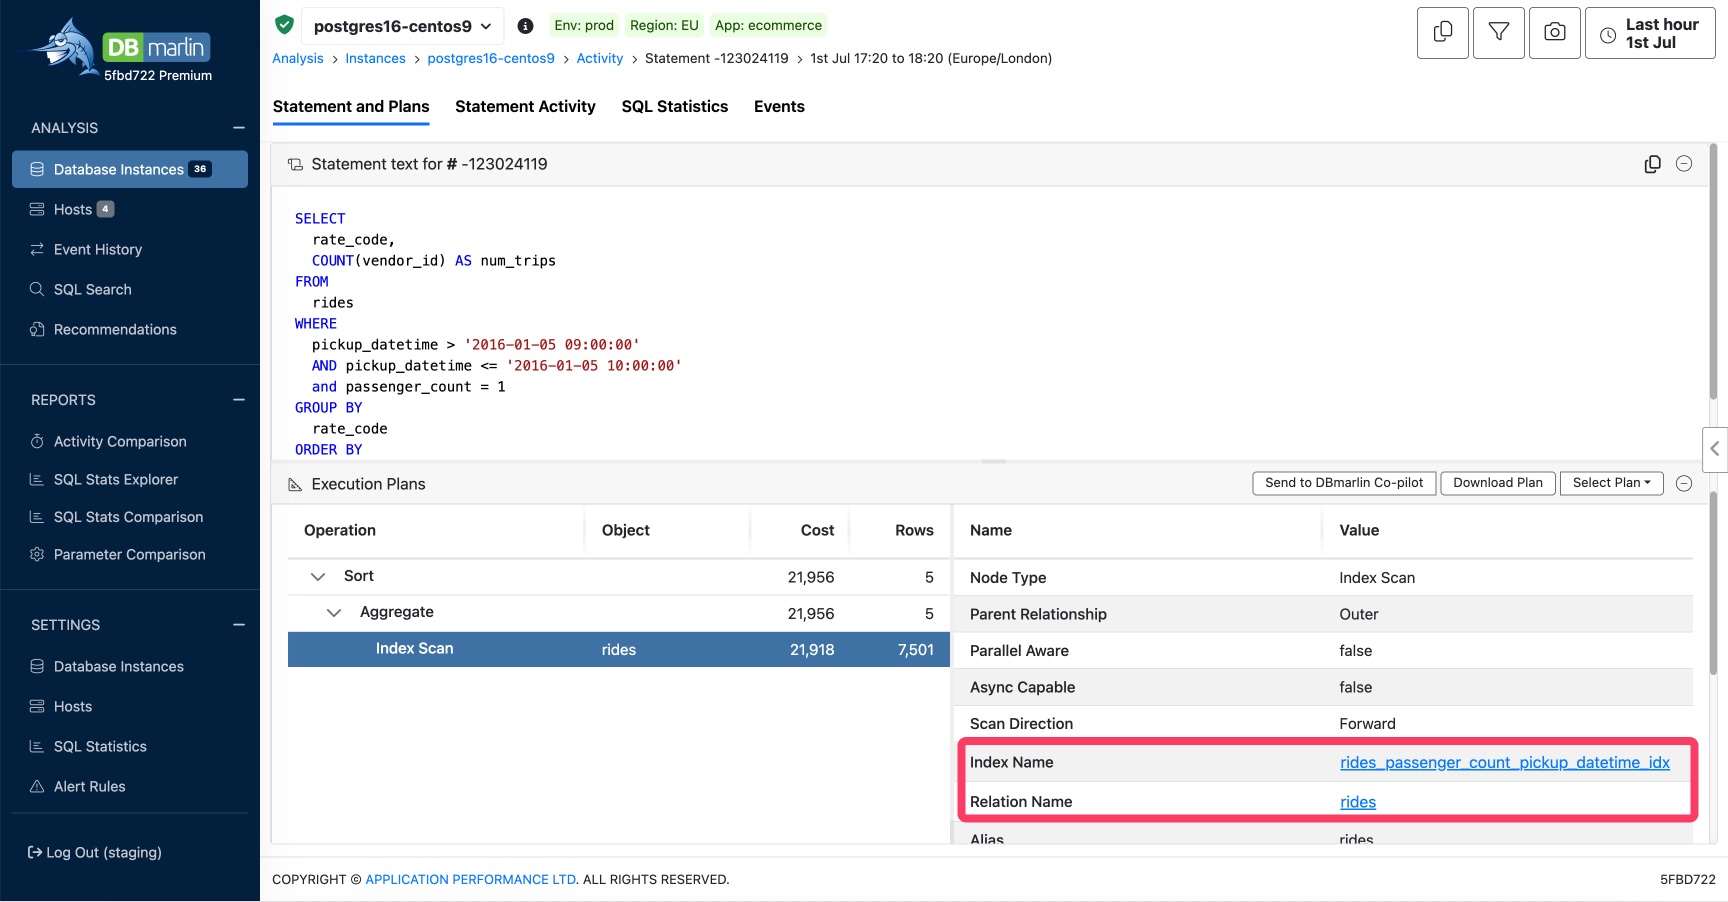
You can navigate directly from elements in execution plans to the Object Browser, making it much easier to investigate performance.
To enable the collection of object statistics, head to Advanced settings, there’s now a toggle to control whether Object Statistics are collected.
Video walkthrough of DBmarlin 5.7
🛠 Many other enhancements
As usual we’ve also crammed in several other updates and fixes into this release.
- PostgreSQL version has been updated to include latest performance and security fixes.
- TimeScaleDB version has been updated for better compatibility and performance.
- Please note that if your original installation of DBmarlin was from v1.5 (May 2021) or earlier then there maybe extra steps required to upgrade to DBmarlin 5.7. Please contact support@applicationperformance.com for advice.
See the release notes for a full list of changes. https://docs.dbmarlin.com/docs/Release-notes/v5.7.0