
Transaction contention in CockroachDB
My colleague Mick wrote about how you can use DBmarlin to troubleshoot database sessions that are blocked by other sessions due to locking in. DBmarlin supports identifying blocking sessions in most of our technologies. One exception is CockroachDB. Although, in theory, blocking sessions can be identified in CockroachDB, in practice, the overhead of doing so is too high. As with all monitoring tools, DBmarlin does not want to be the cause of performance problems. Therefore, for CockroachDB, we have taken a different approach and use the built-in transaction contention mechanism.
In version 4.9.0 and above, the detection of transaction contention may be enabled in Database Instances > Edit > Advanced Mode.
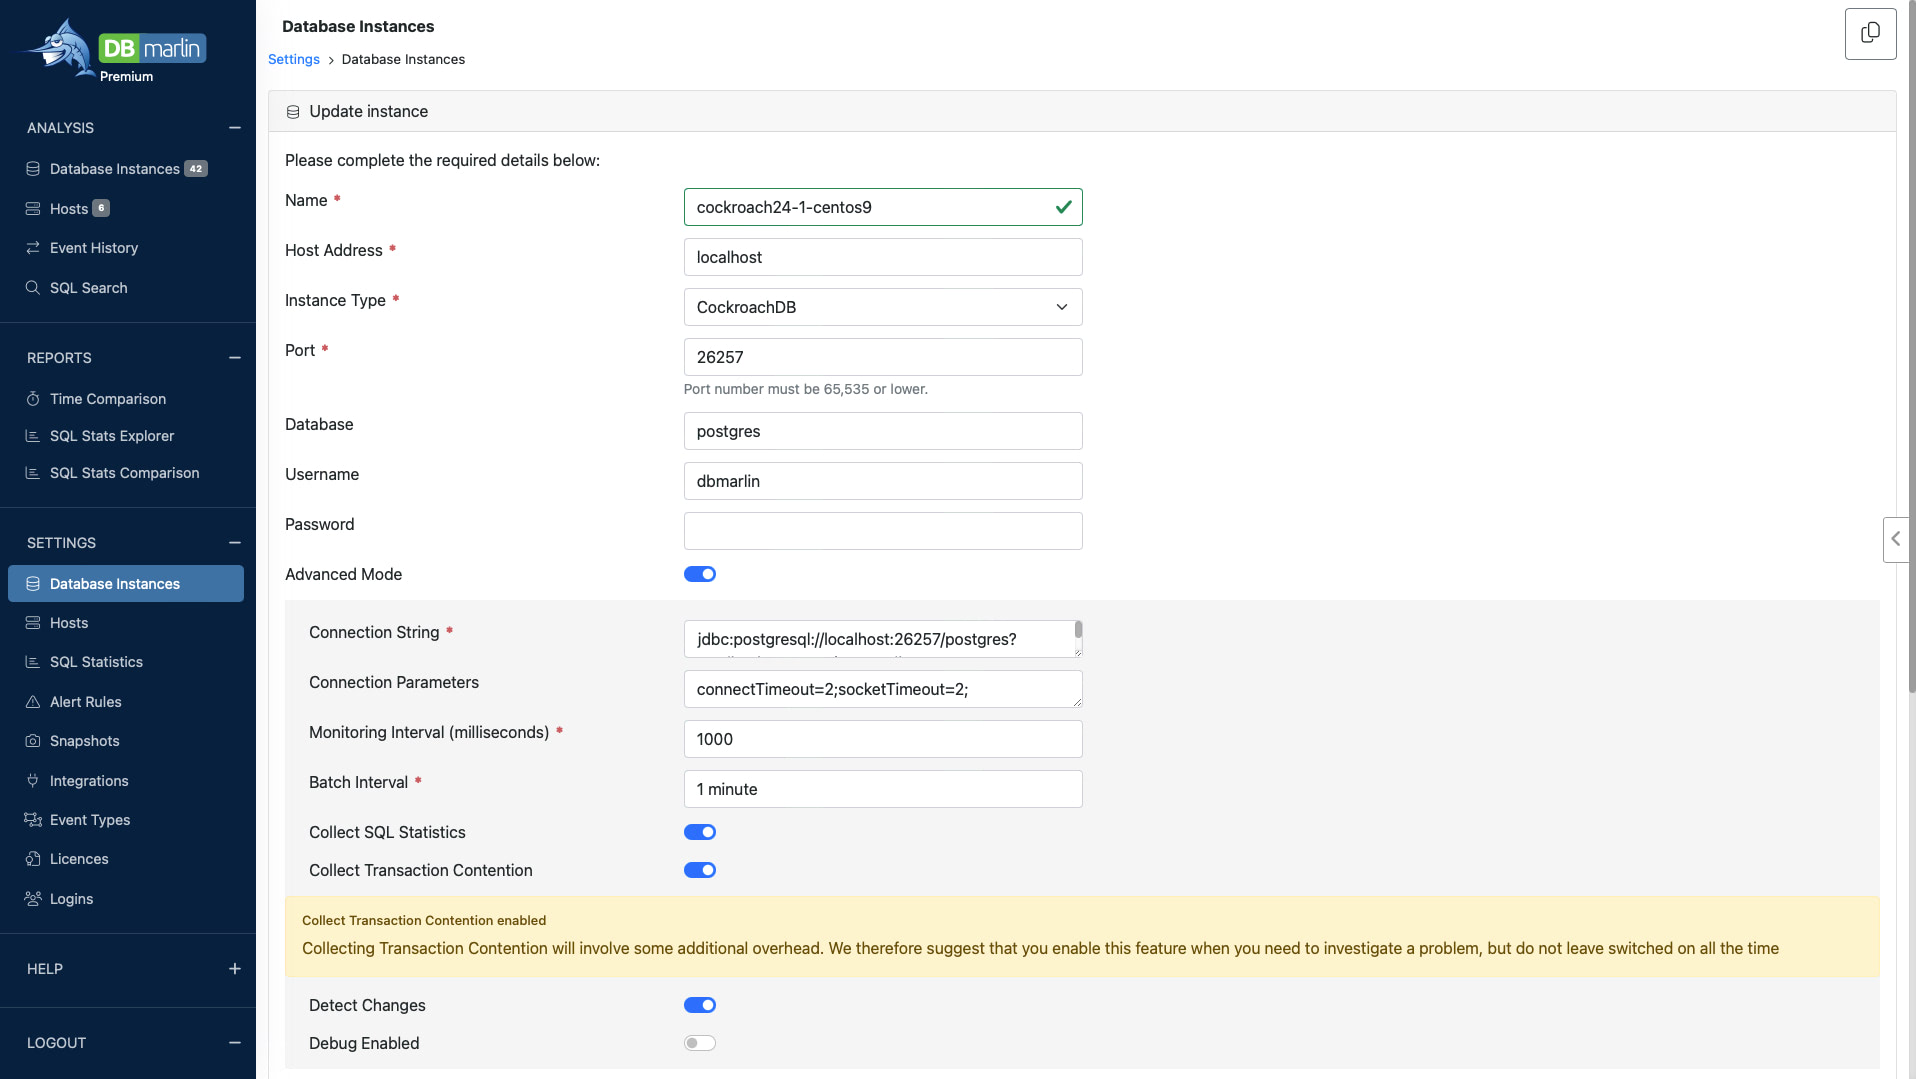
While this is a fairly new feature we are being cautious about its potential overhead. The warning may be dropped in the future.
Once enabled, an extra Transaction Contention tab appears in the instance details screen.
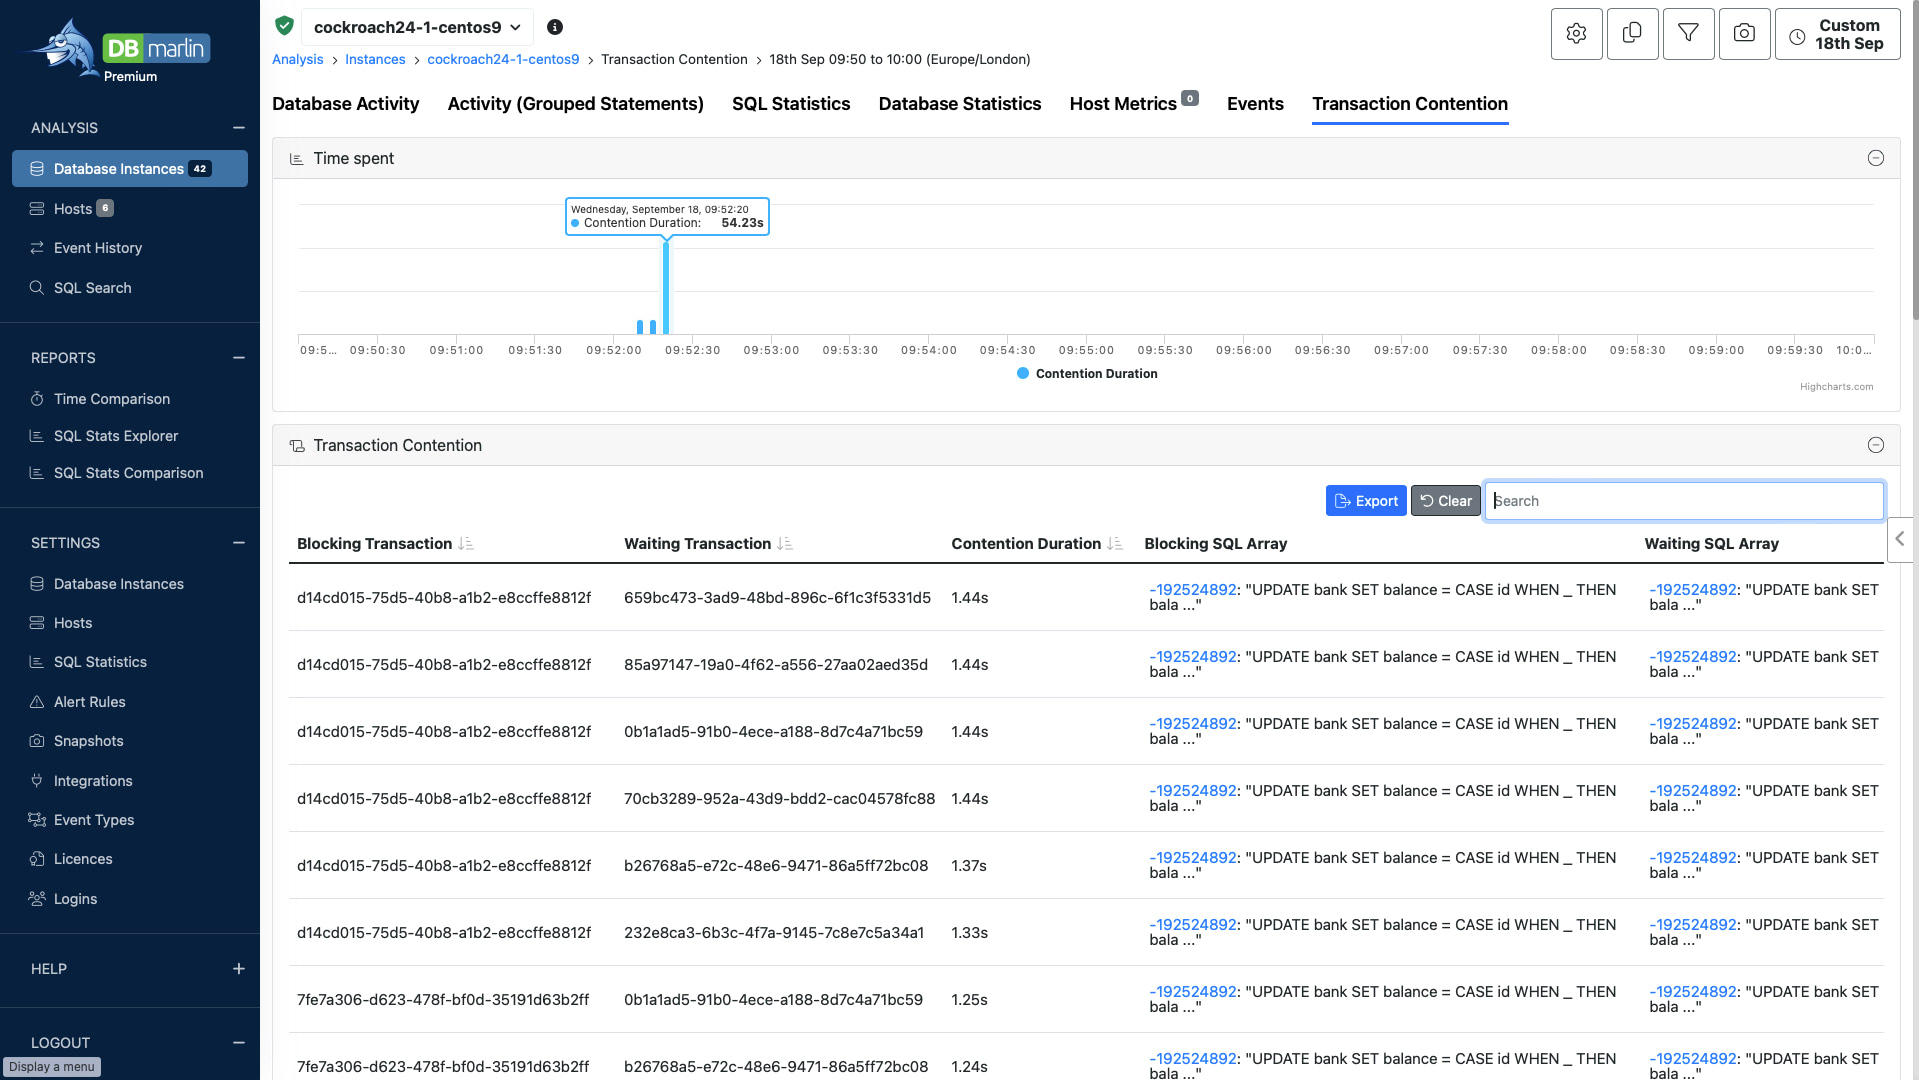
The CockroachDB sample application bank was run for one minute between 09:52 and 09:53. This spawns a number of sessions busy updating bank balances. The table below the graph shows blocking and waiting transactions together with their contention duration. There was about 1 minute 12 seconds of contention wait overall. In this example, there was only one statement running in the transaction but in the general case there may be a set of statements running as a transaction. This is why we capture a blocking SQL array. Usually it will be an insert, update or delete statement that causes the actual contention.
You can click on the hash value of one of the statements to take you to the same statement in SQL statistics screen.
There are a few things to note here. The first is that bar in the graph is at 09:50 and not between 09:52 and 09:53. This is because contention events are captured as they happen but SQL statistics are only recorded by CockroachDB at every aggregation interval. In this environment the CockroachDB aggregation interval has been changed from the default of 1 hour to 10 minutes. The bar at 09:50 should be interpreted to cover the time from 09:50 until (but not including) 10:00. We actually wait until 10:10 to record the statistics as the values can be volatile until the next interval has expired.
If you are still using the default aggregation interval the you would need to expand the time range and read from 09:00 until 10:00. Also you would have to wait until 11:00 to see the data for 9 until 10 due the volatility. We were able to reduce the aggregation interval in our test environments where this application was run but whether you can is a decision you will have to make internally, perhaps in conjunction with Cockroach support.
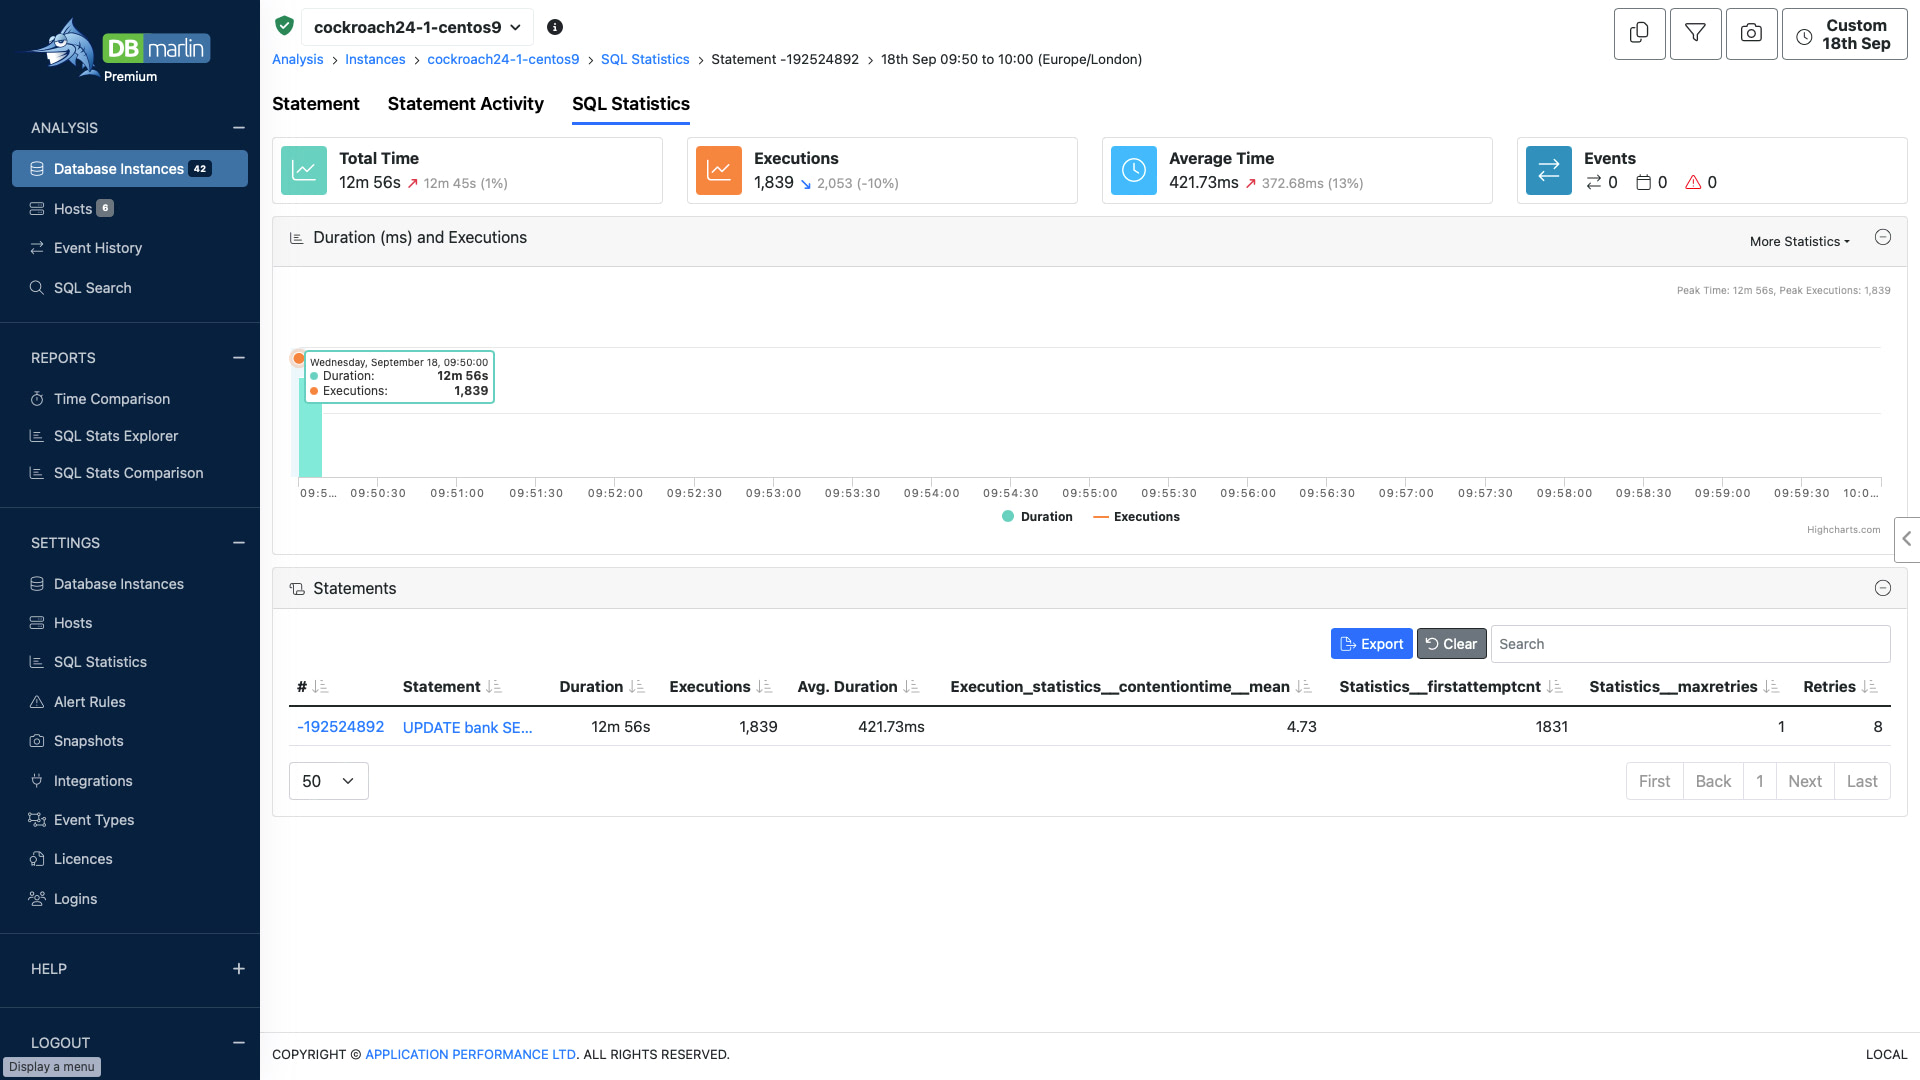
The second thing to note is that the figures are for all executions of the UPDATE bank statement and not just for the transaction clicked on in the previous screen. We can see the total duration is 12 minutes 56 seconds, so contention accounted for about 1:12 divided by 12:56 multiplied by 100 or about 9% of the total time. In one minute the statement was run 1,839 times or about 30 times per second.
Further statistics show us that all but 8 statements completed first time (Statistics__firstattemptcnt = 1831 and Retries = 8). The maximum number retries that any one invocation made was 1.
It is not possible with CockroachDB to go directly from the SQL Statistics view of a statement to the Statement Activity view because CockroachDB normalises the text in SQL Statistics and it gets assigned a different hash value.
One way to move between the two is to make use of SQL Search. Here we search for a common fragment of the statement, namely UPDATE bank.
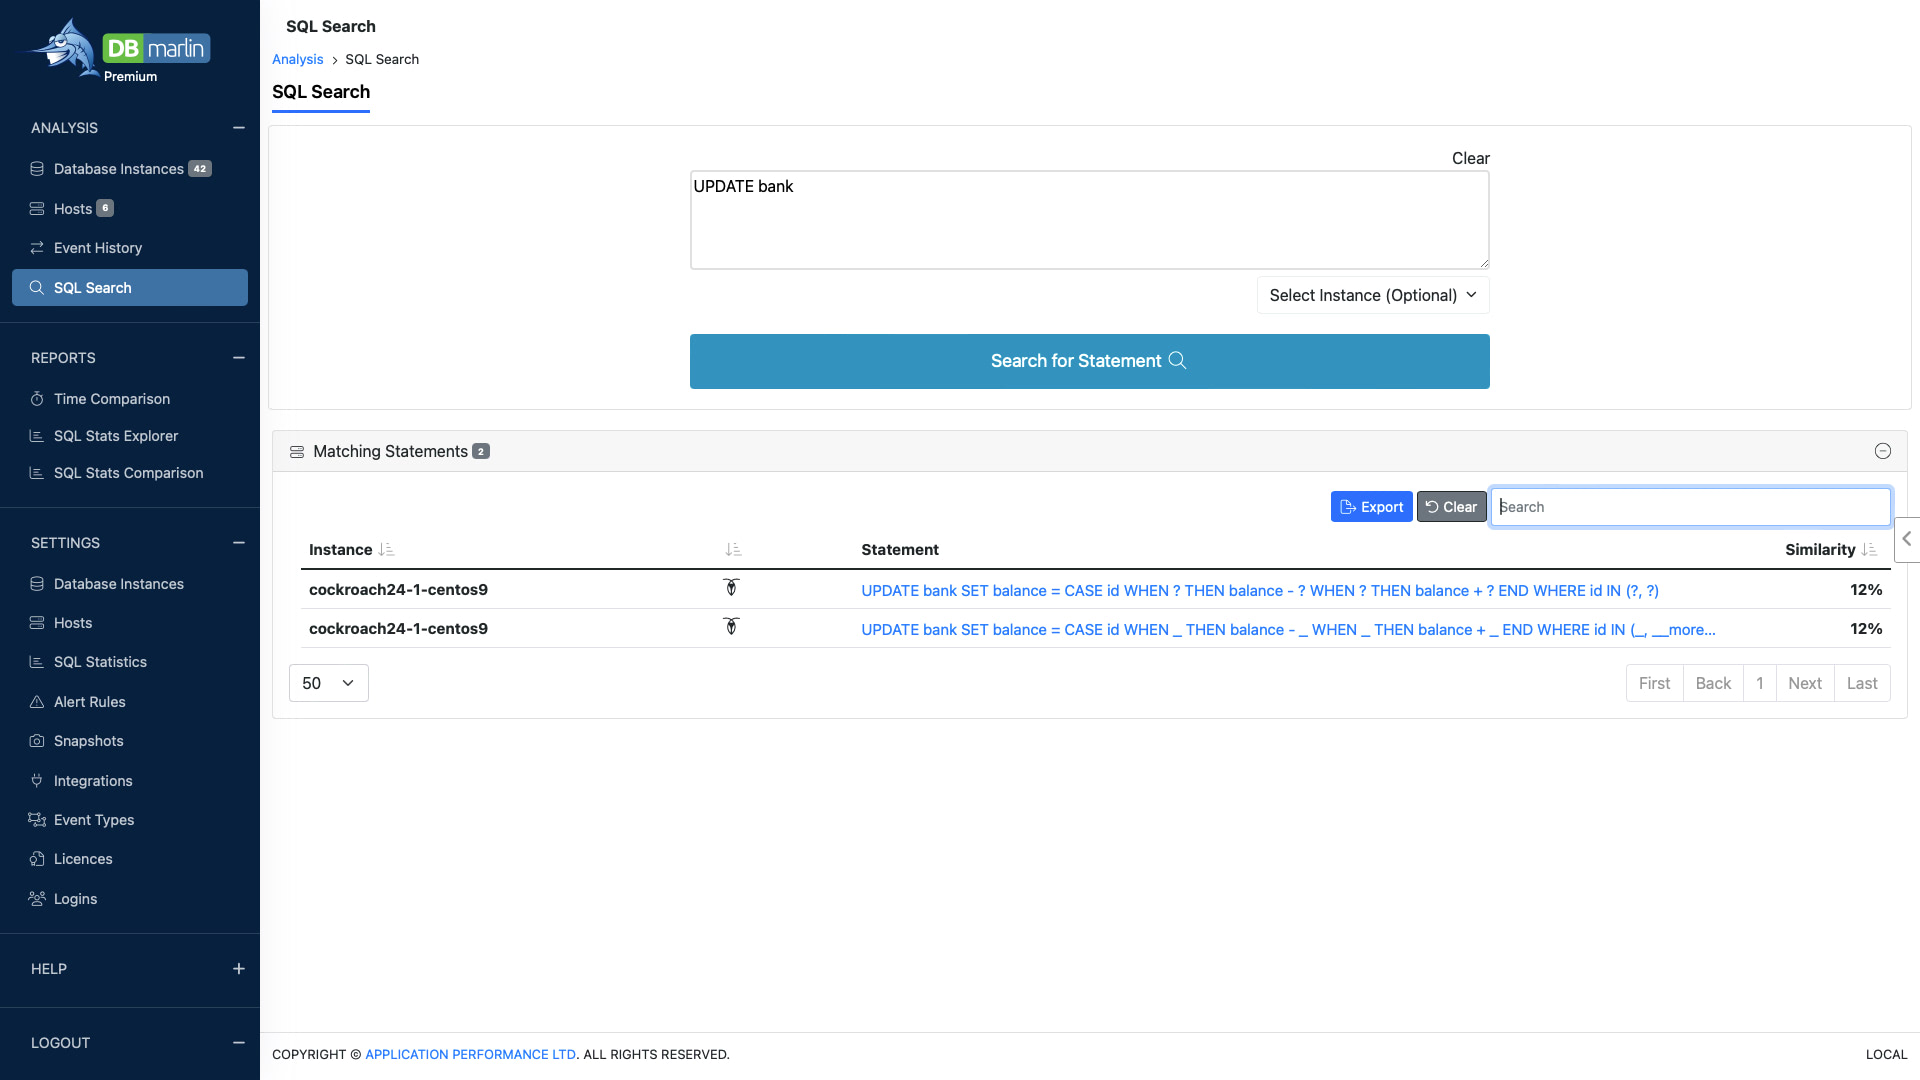
We can click on the first entry, which is the activity-based version. We need to adjust the time range and set it to 09:50 to 10:00, as the default is last one hour. Clicking through we end up at the Statement Activity tab.

We can see from the activity-based view that we have the right statement that ran between 09:52 and 09:53. Activity is real-time, there is no need to wait for aggregation. The total execution time was 12 minutes 49 seconds, which is close to the statistics-based figure of 12 minutes 56 seconds.
CockroachDB does not provide many wait events, certainly compared with other technologies. So we just see that it spent most of its time executing. There are no lock waits for example.
At the bottom of the screen we can filter by various dimensions. We can see that the bank-run.sh script ran 16 parallel sessions with the workload evenly distributed.
Having reached this point, what can we conclude about CockroachDB contention in this case? Contention is not too high at 9% of the time but it is questionable whether it is worth adding more parallel sessions. Most of the contention actually occurred early on. The peak was at 09:52:20; there was almost no contention as 09:53 approached (you can see this in the contention over time graph, comparing it with the activity over time graph). Perhaps as more data is cached the contention time reduces.
Want to try it out?
Getting started takes minutes. Head over to dbmarlin.com to get started.