Integrating DBmarlin with Your DevOps Toolchain

Most teams monitor apps and infra pretty closely. Databases? Not so much. They usually get attention only when something breaks.
DBmarlin fixes that. It hooks into your pipeline so you can see how database performance changes every time you ship code.
Works with whatever you’re already using
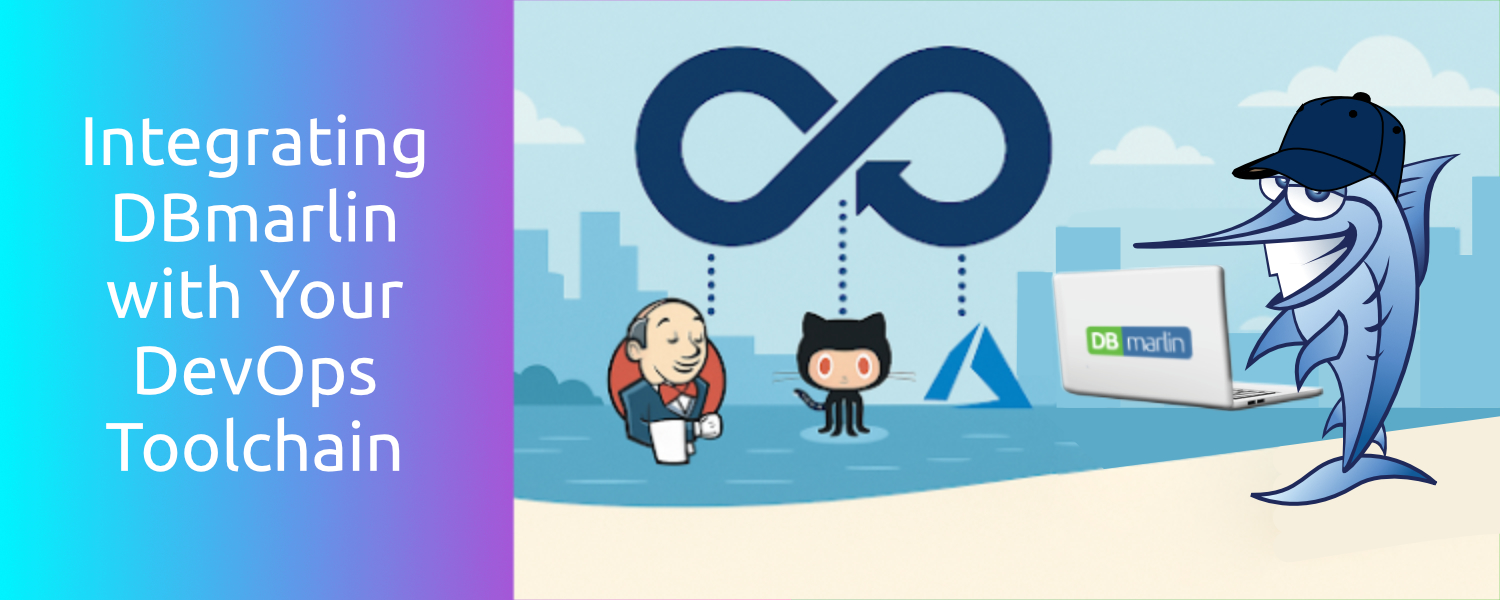
DBmarlin integrates cleanly with your CI/CD pipeline. Whether you’re using Jenkins, GitHub Actions, Azure DevOps, or custom scripts, you can send deployment events directly to DBmarlin using a simple API call.
In Jenkins, you can add a post-deploy step that makes an HTTP request to DBmarlin’s event API. This marks the deployment on your performance timeline, so it’s easy to correlate changes in query performance with specific builds. DBmarlin also supports time-based comparisons, so you can review how performance shifts before and after each release.
In GitHub Actions, just add a shell step to call the API using curl. Include relevant details like the commit SHA, environment, and release version. These annotations show up in DBmarlin’s UI and help you link code changes with any performance shifts.
In Azure DevOps, use a script task to send the same kind of API request. You can mark deployments, schema changes, or any other key event that might impact performance. For other tools or custom pipelines, DBmarlin’s REST API can be called from anywhere. Drop it into Bash scripts, Python automation, or config management tools like Ansible. As long as the tool can make HTTP requests, it can work with DBmarlin.
You can use these event annotations to:
- Mark deployments and changes across environments
- Track performance impact over time using DBmarlin’s reports
- Build a clean, searchable history of change and performance
Mark releases automatically
DBmarlin lets you add event markers to your performance timeline using a simple API call. These markers help you track when deployments happen, so you can clearly see the impact of changes.
You can wire this into your deployment scripts by sending an HTTP POST to the /archiver/rest/v1/event endpoint. The payload can include a name, description, environment, and timestamp. You can also link out to your CI job or version control system for added context.
Once the marker is in place, it appears in the DBmarlin UI alongside your performance data. That makes it easier to understand when something changed and what might have caused it.
You’re not running tests or triggering performance analysis with this step. You’re just making sure changes are recorded so you can review what happened before and after.
This works well with DBmarlin’s comparison views. After a release, you can compare performance across time windows and spot any differences in query behaviour or load.
The integration is lightweight. It doesn’t require a plugin or agent. Just a script that makes a POST request from your pipeline.
Catch issues before users do
DBmarlin continuously tracks query performance, CPU usage, wait events, and locking across all supported databases.It captures performance data in real time and shows it on a timeline so you can spot changes quickly.
You don’t need to wait for users to report slowdowns. If query durations increase, or wait times start creeping up, you’ll see those changes right away in the DBmarlin dashboard.
The system breaks data down by database, user, application, and wait type, so you can quickly isolate where the problem is coming from. You can drill into specific time periods and see which queries were consuming the most resources, which sessions were blocking others, or whether a change in concurrency triggered a bottleneck.
While DBmarlin doesn’t include built-in alerting, many teams use it alongside existing monitoring systems. They rely on their primary observability platform to send alerts, and then use DBmarlin to investigate and confirm the root cause. DBmarlin gives the visibility that traditional infrastructure monitors tend to miss.
Instead of guessing or waiting for patterns to repeat, you can track performance trends over hours, days, or weeks. That helps you catch regressions early, understand the real impact of a change, and avoid repeat issues.
Shared visibility across the team
DBmarlin’s web UI gives everyone the same view of what’s happening in the database. Developers, DBAs, SREs, and product teams can all access the same data, without needing separate tools or custom queries.
You can see what changed, when it changed, and how performance shifted before and after. Whether it’s a new release, a schema update, or increased load, the impact is clear on the timeline.
Each event marker gives context, and every performance metric is tied to a specific window of time. You’re not digging through logs or waiting for someone to explain what happened. It’s all in the UI.
This shared view helps reduce back-and-forth. If someone says the database is slower after a deploy, you can look at the data together and either confirm it or rule it out.
The interface is built for clarity. You can filter by database, application, or user. You can focus on specific queries, dig into lock behaviour, or just scan the high-level trends.
No need for everyone to become a performance expert. The charts and reports make it easy to explain what’s going on and align on next steps.
Make performance part of the process
Performance shouldn’t be something you only think about when things go wrong. With DBmarlin integrated into your workflow, you get visibility into how database behavior changes over time, so you’re not flying blind between incidents.
Developers can see how their changes affect query performance. If a new release introduces a slower query or increases load, it shows up clearly in the timeline. This helps teams catch problems early, before they show up in production or impact users.
Ops teams can use the historical data to spot trends and understand how the system is evolving. Whether it’s tracking the impact of an infrastructure upgrade, a configuration tweak, or a new usage pattern, the information is there. You can go back and see exactly what was happening around any performance shift.
Since everything is tied to specific points in time, there’s no need to piece together logs or guess what changed. DBmarlin gives you a running record of how performance maps to your delivery process.
This makes it easier to improve things over time. You’re not just reacting to problems. You’re building up context and learning from every change.
The result is better collaboration, faster debugging, and fewer surprises. Performance becomes part of how you build and ship software, not a separate concern.
Want to try it out?
Getting started takes minutes. Head over to dbmarlin.com to get started.

