
DBmarlin 2.7 released - with New Relic integration
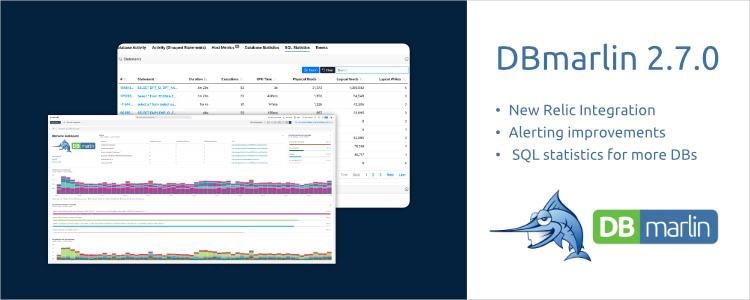
We are pleased to announce version 2.7 of DBmarlin, where we have added our integration with New Relic. This allows users of both products, to see DBmarlin’s database performance data within their New Relic dashboards. We have continued to add more alerting features, so you can now see alerts in more places within the product. Finally this month we have started to roll out our SQL statistics screen to more database types, including Oracle, IBM Db2 and CockroachDB, in addition to SQL Server.
New Relic integration
New Relic started as an APM (Application Performance Management) platform and has evolved into a complete observability platform that helps teams build better software. This means you can bring in data from any digital source in the form of Metrics, Events, Logs and Traces (often referred to as MELT data).
One data source which has long been a lacking in New Relic is deep database performance. With DBmarlin we can now fill this gap. DBmarlin sends database performance data, including database time, top SQL statements and top wait events, to New Relic, so you can see when database slowdowns occur and what is causing them.
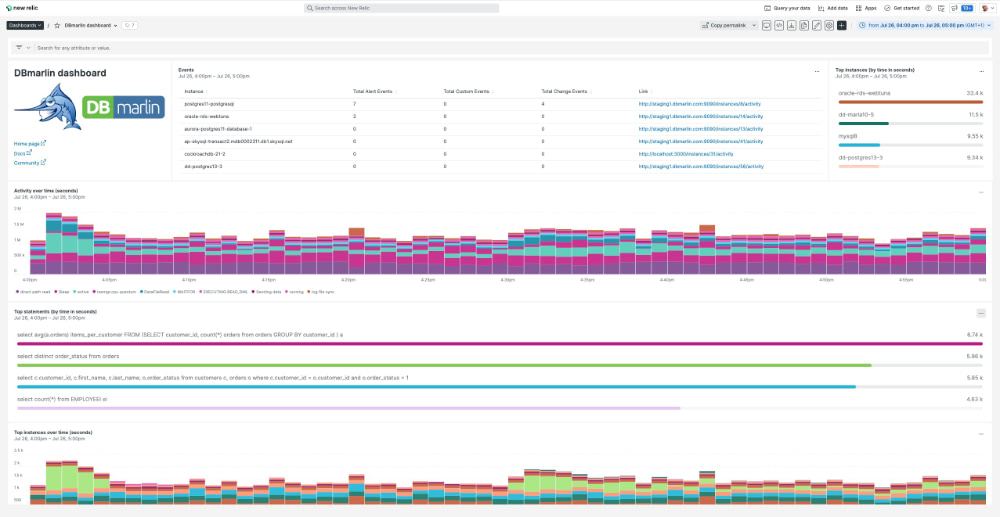
If you are already using New Relic, you can search for the DBmarlin quickstart and follow the steps there. This links to our New Relic page in the DBmarlin docs which describes the steps to enable DBmarlin to start forwarding event data to New Relic.
More alerting
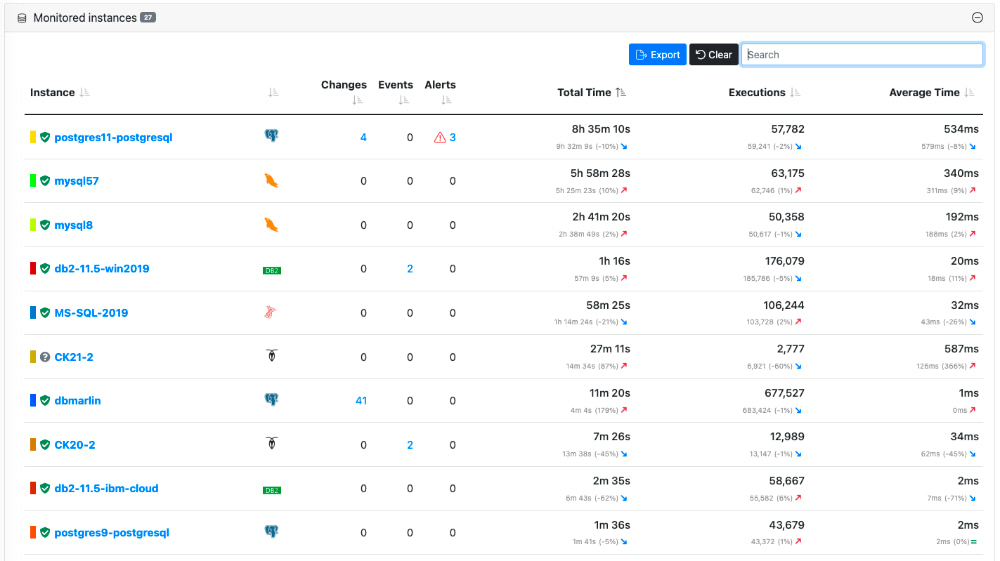
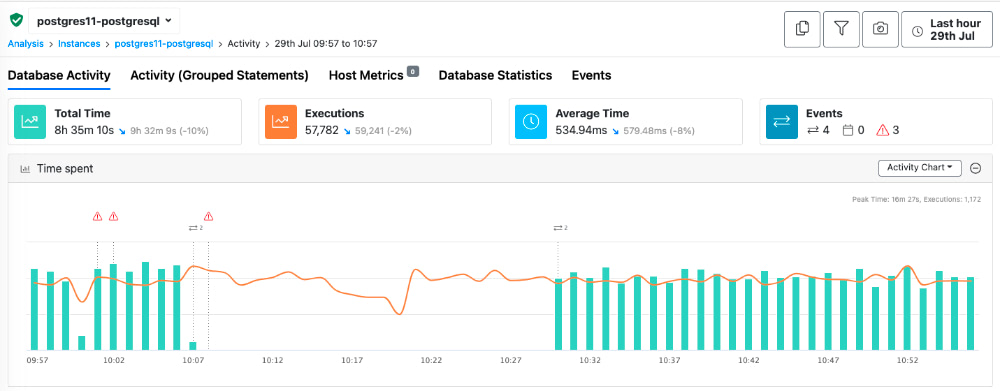
We are now showing Events (Alerts, Changes or Custom) in more places. On the instance overview screen you will now see 3 columns for Alerts, Changes and Custom events.
When looking at an individual instance, you now see an Events tab with just the events for that instance.
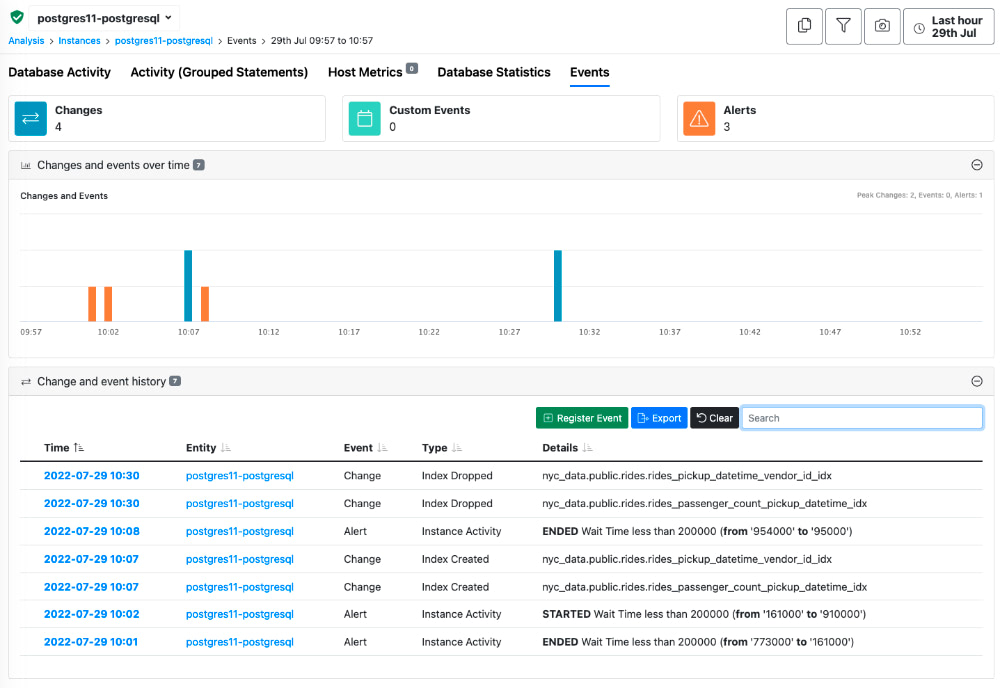
On the charts you will see markers for the different event types so you can see if they had an impact on database performance.
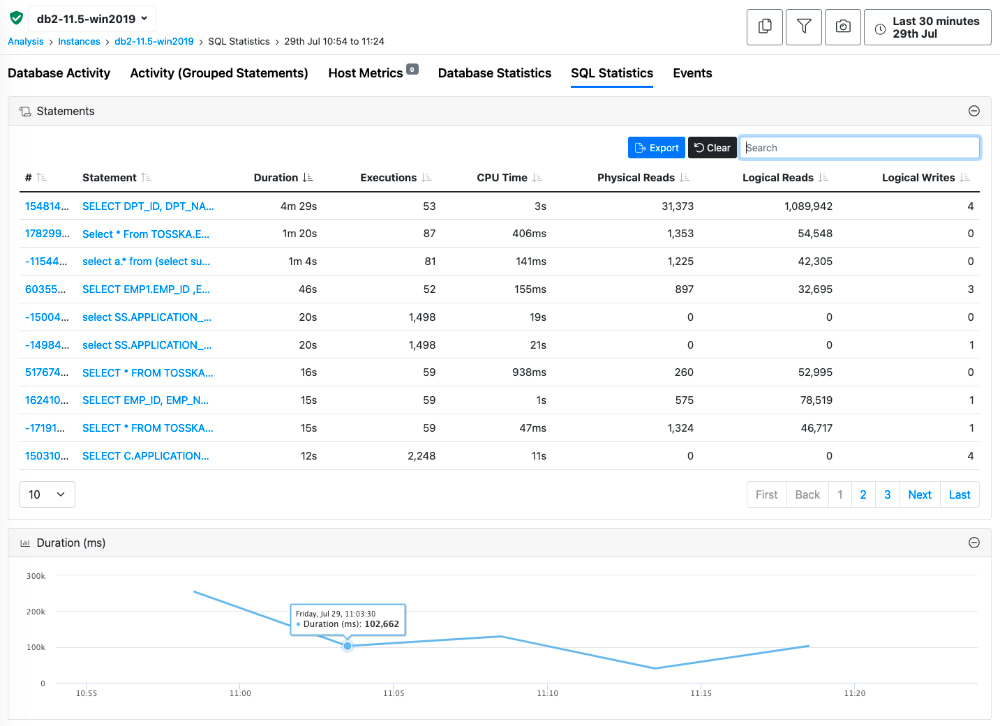
SQL Statistics for more database types
SQL statistics were previously only available for SQL Server and needed to be enabled under Advanced settings. Now we have moved the “Collect SQL Statistics” setting, so it is possible to enable it without having to go into Advanced mode. We have also added the collection of SQL Statistics for IBM Db2, CockroachDB and Oracle and will look to add the remaining database types in an upcoming release. The statistics will vary depending on the database technology, but in all cases will show Duration and Executions and most cases will include CPU time, Physical reads, Logical reads and Logical writes.
Ready to try DBmarlin?
If you would like to find out more about DBmarlin and why we think it is special, try one of the links below.
- Get hands-on without an installation at play.dbmarlin.com
- Download DBmarlin from www.dbmarlin.com, with one FREE standard edition license, which is free forever for 1 target database.
- Join our new community at https://community.dbmarlin.com/invitation?code=74020A