
Why use active session sampling for database performance?
Following my recent blog on database observability, this article digs a little deeper into the different approaches to database monitoring and the benefits and limitations of each.
Approaches to database performance monitoring
Database performance monitoring typically falls into one of these 3 categories, characterised by the type of data that is collected:
Data collection | Provided by | Examples of data collected | |
1 | Database instance metrics | Many tools such as system monitoring tools, application performance management (APM) tools and others. | Examples would be number of sessions or connections, number of reads or writes and other high-level metrics about overall instance performance. |
2 | SQL statement metrics | A small number of APM tools and some dedicated database monitoring tools | Examples would be logical reads, physical reads, writes or CPU time at the individual SQL statement level. |
3 | Active session sampling for time-based wait-state analytics | A small number of database monitoring tools (including DBmarlin) | Measures total ‘database time’ which can be broken down by many dimensions such as wait-event, SQL statement, user, program, session and more. |
With DBmarlin we provide all 3 of these types of data but most monitoring tools only provide 1 or sometimes 1 and 2. In this article I will try to explain why you really need 3, (in addition to 1 & 2). We look in detail at how active session sampling actually works and why it is so important when understanding database performance.
Strengths of each approach
Let’s look at what each of these types of data is good for (and what they don’t provide).
-
Database Instance metrics are good indicators of limits being hit (or getting close). For example if your database has max-connections of 500, it would be good to know when you are approaching that limit. Or if your database can handle 2000 IOPS and you are nearing that limit you should know ahead of time so you can plan for it. What database Instance metrics don’t tell you though is the why. Why are you hitting max-connections or why are your IOPS so high? Which user, program or SQL statement is causing it?
-
SQL statement metrics are good indicators of slow performing queries or transactions. For example, if a statement is doing a lot of I/O per execution or using a lot of CPU time per execution and the execution count is high then it is good to know about it so you can think about tuning that statement. While it is true that database do often spend most of their time either using the CPU or doing I/O there are hundreds of other things that statements could be blocked on and these are known as wait-events in most database systems. What SQL statement metrics don’t tell you, is whether the statements were slow because of contention on a particular database resource such as a lock or latch.
-
Active session sampling for time-based wait-state analytics lets you understand how much time your database spent executing statements and allows you to break it down by session, program, user, client IP, wait event, statement, database/schema and more. For example, your database spends 500 hours in a day executing statements but you can see that 80% of that time is on one statement and you know which user and program it came from and that it spends most of its time blocked due to a particular wait event. What active session sampling doesn’t tell you though is whether that contention is caused by limits being hit at the instance level. Also it isn’t able to tell you how many times a statement was executed (at least for most databases) so you don’t know if it was a long running statement run once or a faster statement executed many times.
How does sampling active sessions work?
With applications you can instrument code in order to trace the code execution and get a breakdown of where the time is spent (which micro-service and in some cases which method within your code). With databases however, you might have thousands of SQL statements executing every second and there is no way to trace the performance of every one of them without incurring a huge overhead on the database.
Sampling active sessions is the best way to get a view of the ‘time spent executing’ in the database.
With DBmarlin we sample the active sessions every 1 second by default. Over a longer period of time we can then get a view of the total active time and a breakdown by the session attributes such as user, program, session id, client IP as well as the SQL statement that were running and what they were waiting on.
Obviously when sampling only once every second there is a good chance that very quick statements are missed on many occasions. However, if they are executed often enough, they will be collected, and statistically the total time will be very accurate. If they aren’t executed very frequently then they aren’t a problem for database performance in any case.
Examples of sampling
Here are some scenarios to illustrate how sampling would work. In all cases we are looking at a 10 second period and sampling once a second (the vertical lines) and we have 5 sessions which may or may not be executing a SQL statement at any point during the 10 second period.
Long running statements
Statements that take more than 1 second to execute will be always sampled. Depending on where the start and finish of the statement falls in-between the samples will mean the time allocated to them might be slightly higher or slightly lower than their actual execution time but by no more than 1s. Over longer periods like minutes, hour or days containing more samples, the number that are rounded up and number that are rounded down will be equal. This means the overall times will be accurate.
Example 1
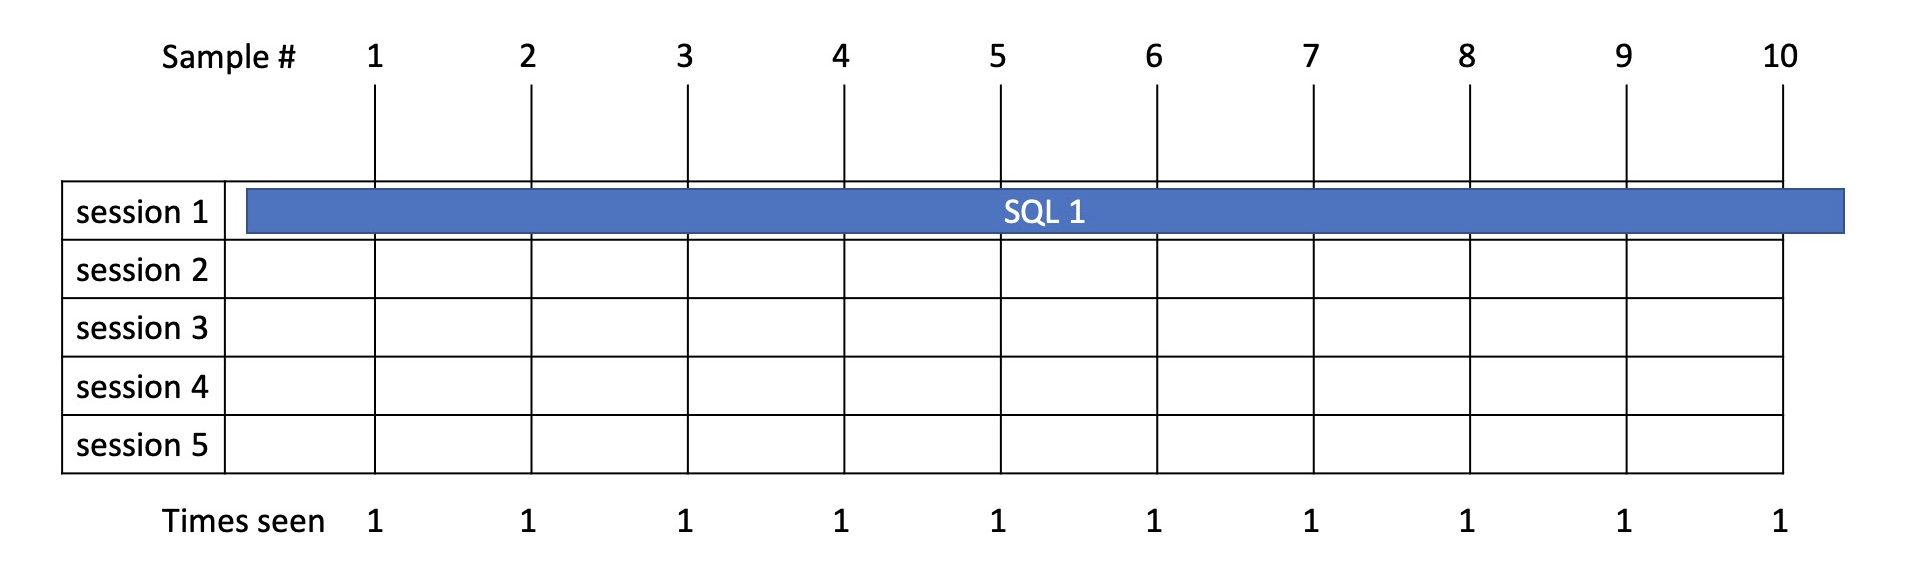
- Here we have a statement running in 1 session which takes 10.3s.
- From sampling we see it running 10 times and therefore allocate total time of 10s.
Example 2
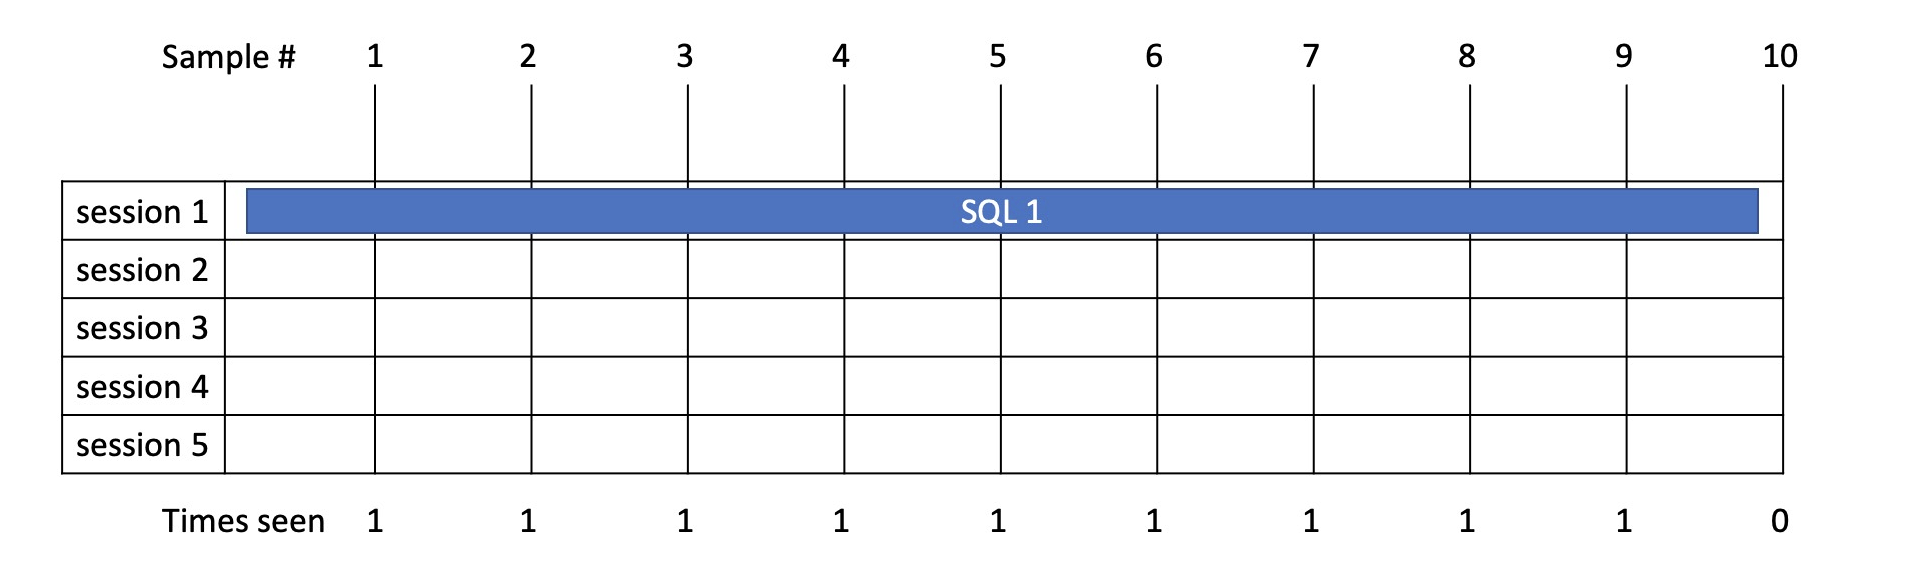
- Here we have a statement running in 1 session which takes 9.8s.
- From sampling we see it running 9 times and therefore allocate total time of 9s.
Example 3
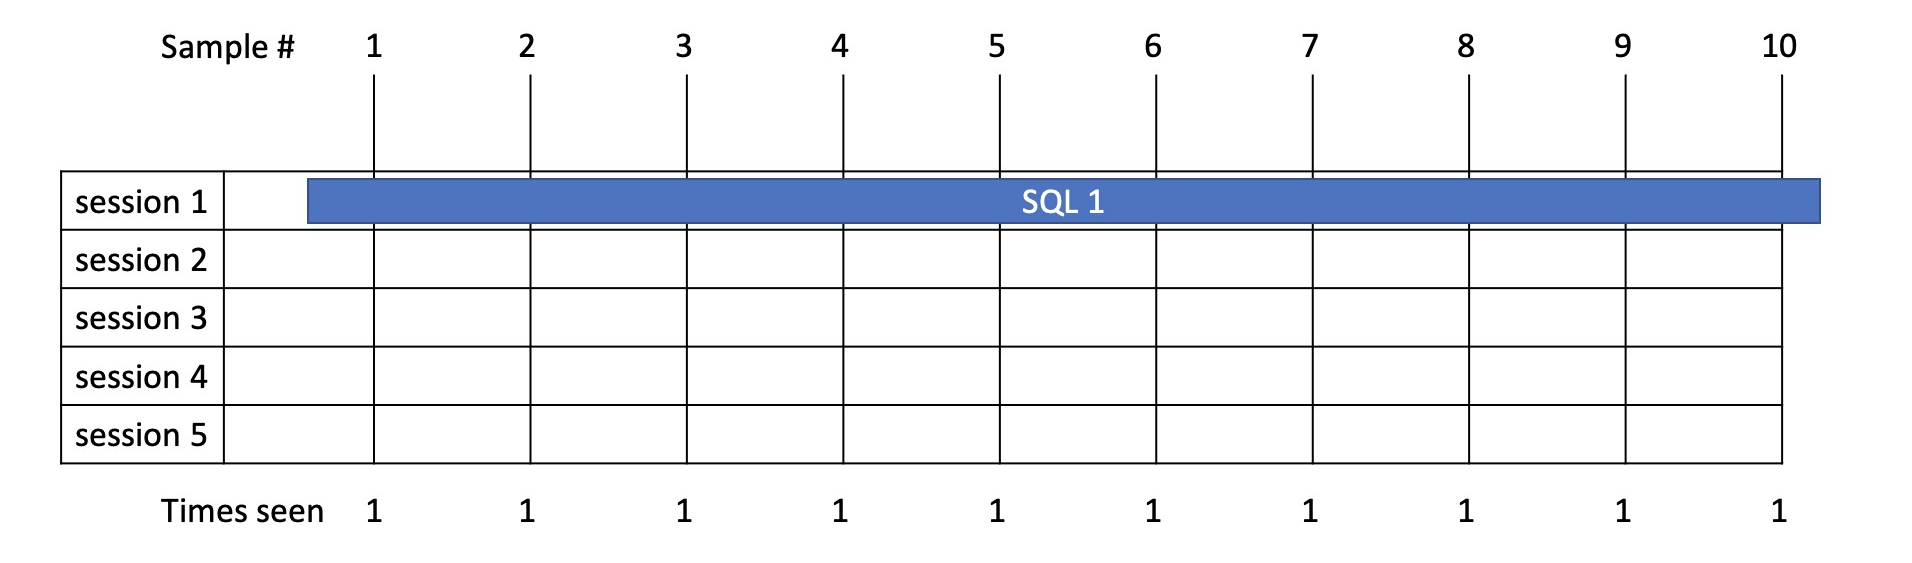
- Here we have a statement running in 1 session which takes 9.8s.
- From sampling we see it running 10 times this time and therefore allocate total time of 10s.
Example 4
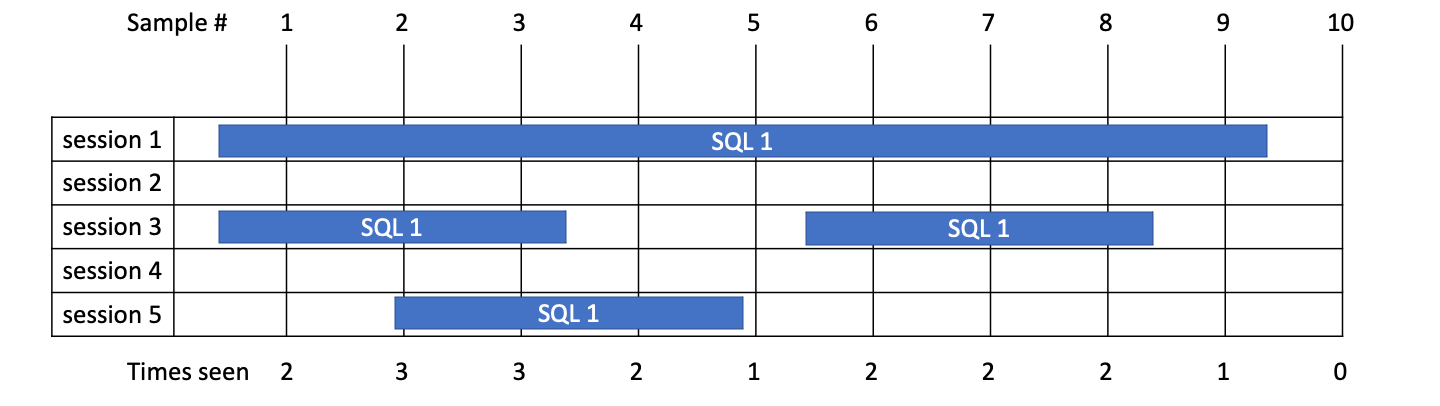
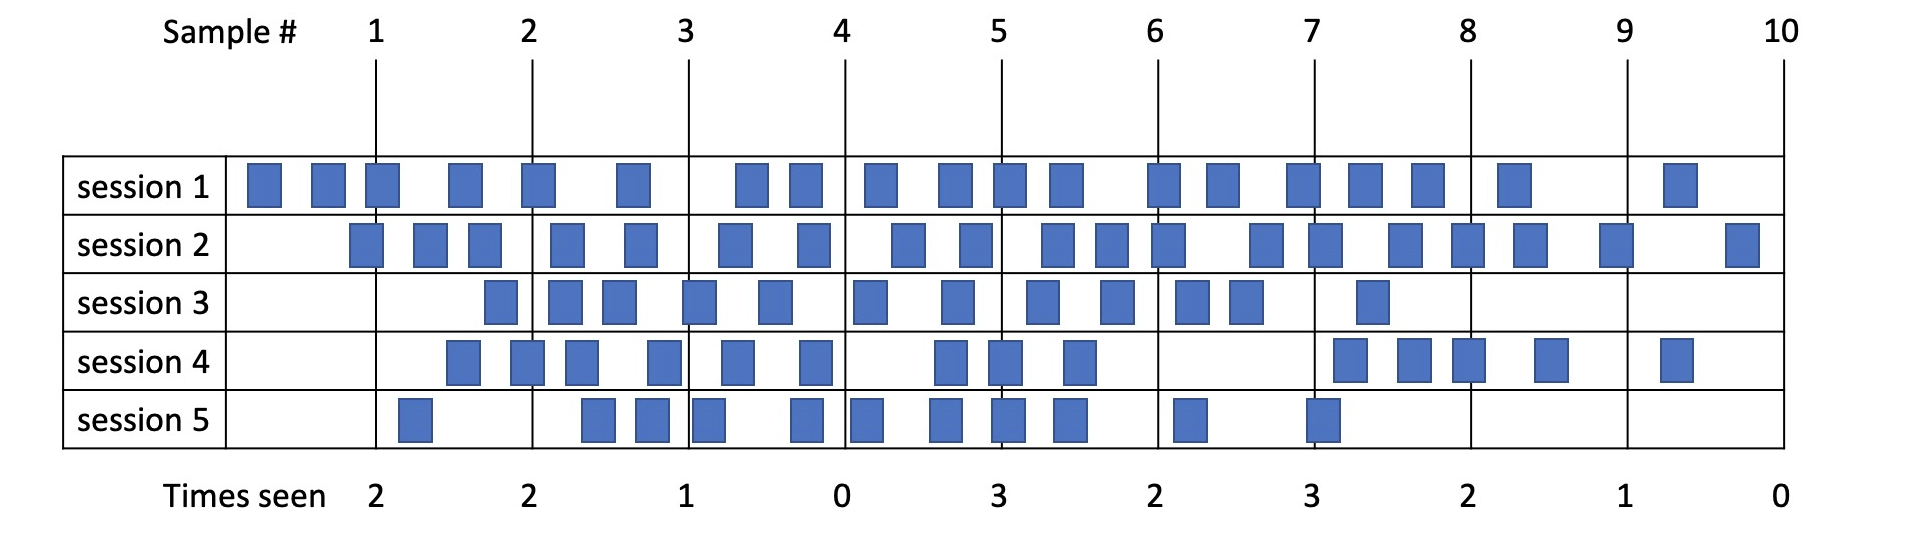
- Here we have SQL 1 which is run in multiple sessions taking 9s, 3s, 3s and 3s = 18s total.
- From sampling we see it running 2 + 3 + 3 + 2 + 1 + 2 + 2 + 2 + 1 + 0 times and therefore allocate 18s.
- We see 4 executions so Average time is 18/4 = 4.5s.
- From sampling, we don’t know the maximum or minimum times for the statement so don’t know that 1 execution took 3x longer than the rest in this case.
Example 5
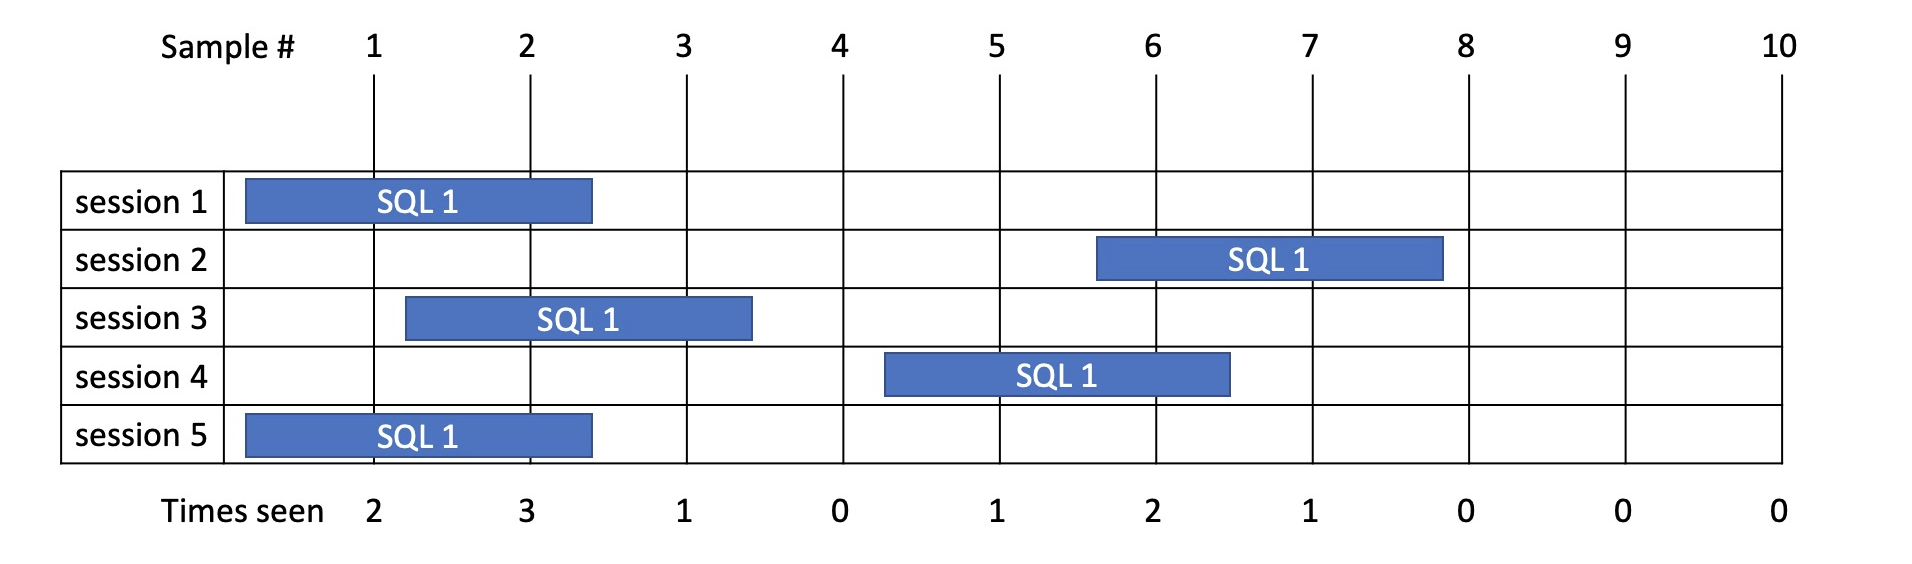
- In this example SQL 1 is run in multiple sessions taking exactly 2.2s each time = 11 seconds total.
- From sampling in this case we see it running 2 + 3 + 1 + 0 + 1 + 2 + 1 + 0 + 0 + 0 times and therefore assume total time of 10 seconds.
- So in this case we are out by 1s but this is over a 10s window. As the window gets bigger sampling become more accurate.
Short statements
As mentioned, short running statements may not be sampled if they run in less than 1 second and fall in between 2 samples.
Example 6
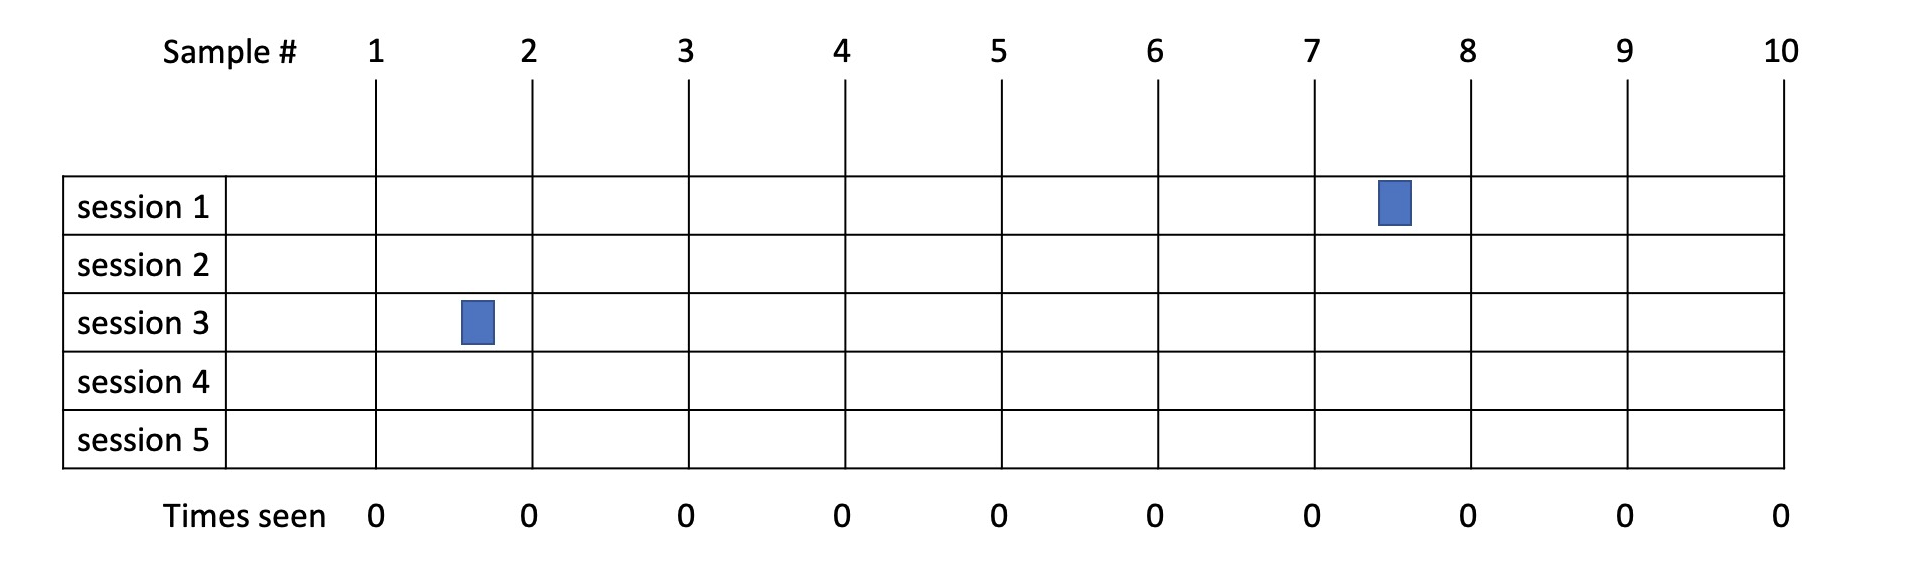
- In this example SQL 1 is runs 2 times taking 0.2s each time so 0.4s in total.
- From sampling we didn’t happen to catch it in this case so allocate 0s to it.
- As you can see, over short time ranges with fast statements the margin for error is high e.g., 0.4s vs 1s but the argument would be that anything taking 1s or less and executed once is unlikely to be your performance bottleneck!
Example 7
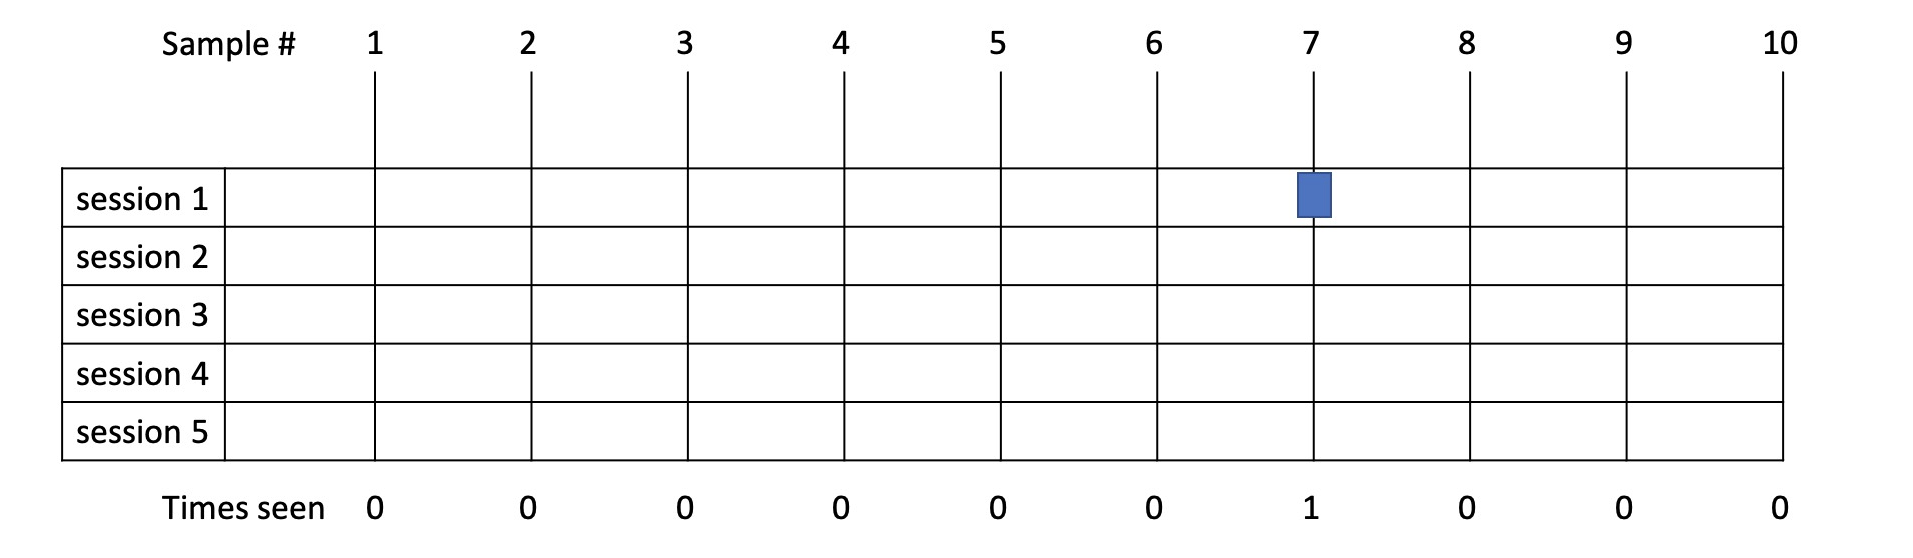
- In this example SQL 1 is run 1 time taking 0.2s.
- From sampling we did happen to catch it in this case so allocate 1s to it.
- As you can see, over a short time range, with fast statements, the margin for error is high e.g., 0.2s vs 1s but again anything less than 1s and executed once is not the performance bottleneck you are looking for.
Example 8
- In this example SQL 1 is run 75 times taking 0.2s each time so 15s in total.
- From sampling we see it running 2 + 2 + 1 + 0 + 3 + 2 + 3 + 2 + 1 + 0 = 16 times so allocate 16s to it.
- Over longer time ranges or when those short statements are run many times, the margin of error decreases.
Conclusion
Hopefully you now have a good understanding of the methodology behind active session sampling and can see how it allows us to take a time-based approach to database performance monitoring. This is the only monitoring method which allows wait-state analytics to determine where active database sessions are spending their time and then break down the time by many dimensions.
Try DBmarlin now to see how it combines database instance metrics, SQL statement metrics and active session sampling across the most popular relational databases.
Ready to try DBmarlin?
If you would like to find out more about DBmarlin and why we think it is special, try one of the links below.
- Get hands-on without an installation at play.dbmarlin.com
- Download DBmarlin from www.dbmarlin.com, with one FREE standard edition license, which is free forever for 1 target database.
- Join our new community at community.dbmarlin.com