
How I quickly solved Azure SQL TempDB File contention with DBmarlin
This is a guest blog by Ezhil Arasu, QA Architect at Encora Inc. describing his recent experience of tuning Azure SQL.
Here, I explain how to find TempDB File contention (SQL SERVER) with or without DBmarlin - a lightweight smart monitoring tool for databases.
- Environment : SQL Server 2019
- Application type : .Net
- Tools : JMeter, Grafana, DBmarlin and SQLQueryStress
In a recent upgrade, we changed the infra with a new SQL server, replacing the old one with exactly the same configuration in terms of CPU cores, CPU logical processors, memory, and storage in the cloud. When we ran our load tests with the defined load, we were able to see more failures/ latency when we exceeded a certain limit of Vusers.
Multiple iterations of run confirmed the same and Azure infra monitoring didn’t hint at anything useful. CPU/Memory Utilisation of App Server looks underutilised and it hints at something to investigate at the database end.
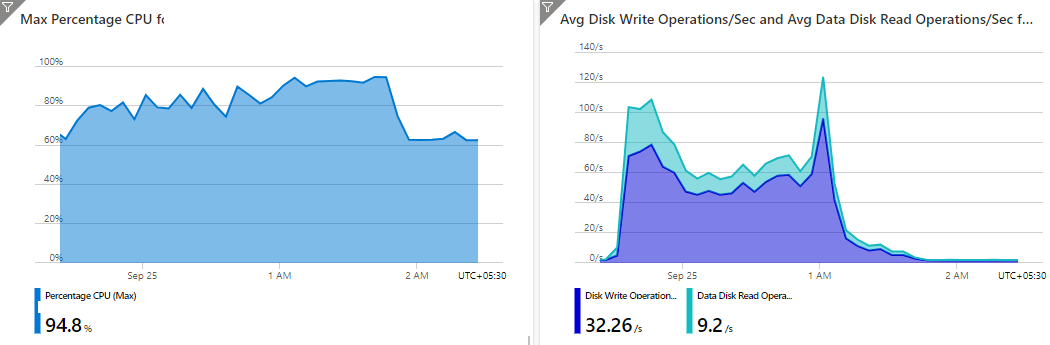
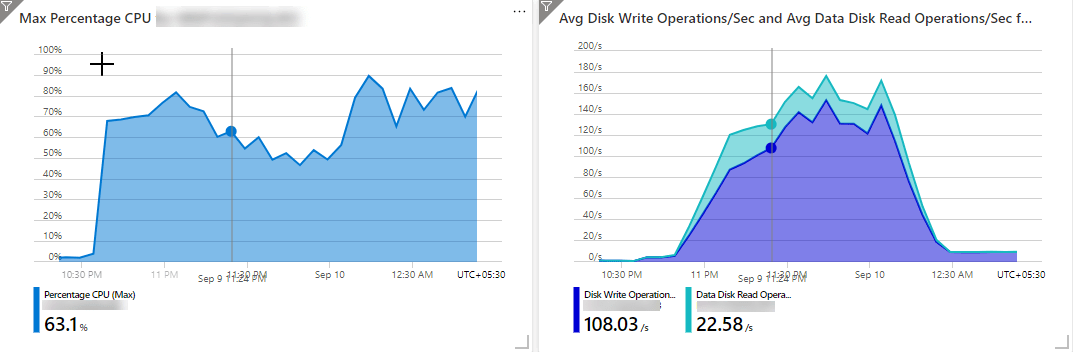
The below metrics are from the SQL server, which show few read and write operations during the load test time. Also, the CPU utilisation is around 80%, but doesn’t exceed above 80% consistently.
DBmarlin for SQL Server Wait Times
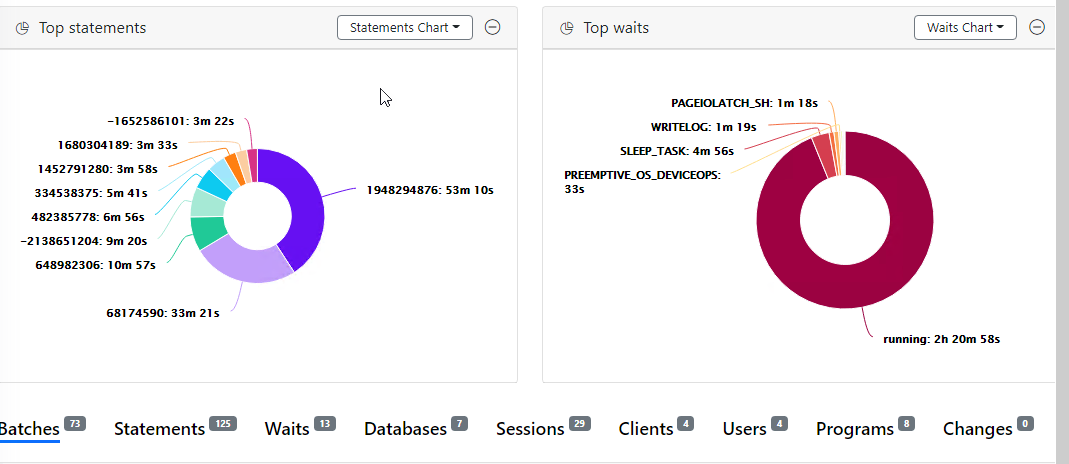
I started looking at the DB side, using DBmarlin to monitor for the same period, and discovered interesting findings. DBmarlin helped much in the case of SQL server wait time statistics, which tell you how long DB is spending on specific waits.
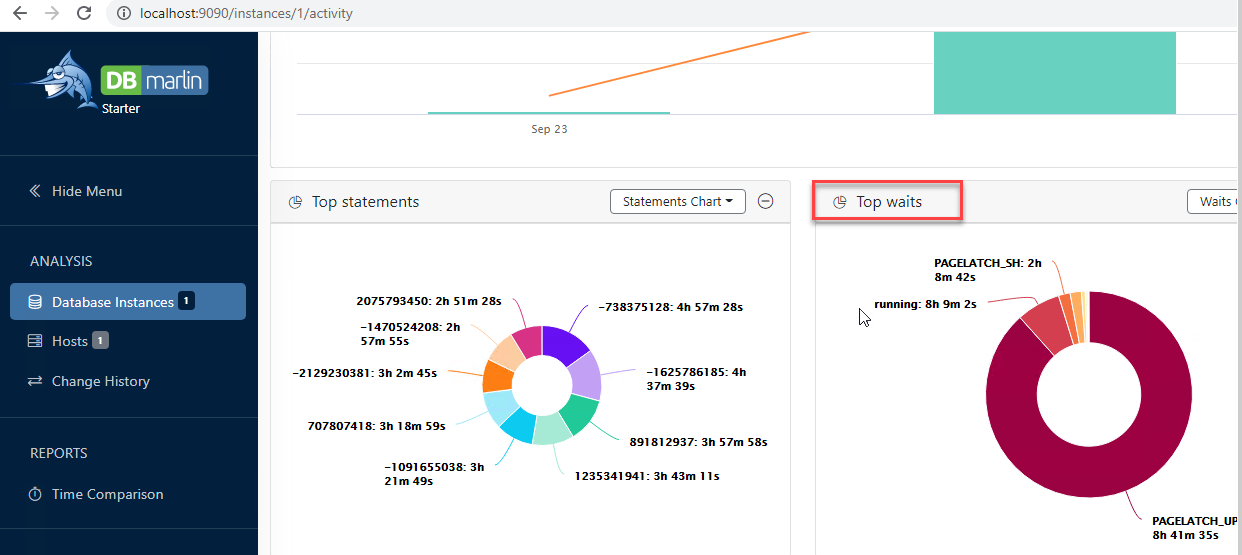
You can see that for the specific duration, most of the time DB was waiting for PAGELATCH_UP followed by running.
Now that you know a little bit about SQL server wait time analysis, you can skip to the next heading.
For beginners I will explain: usually a SQL server will have running, runnable and sleep states. When an app server is trying to execute a specific query, a SQL server DB engine will assign a thread to serve for this purpose. If no threads are available in the SQL server thread pool, then it denotes a CPU contention in the SQL server and it will be in the runnable state.
The ideal case is that it will be assigned with a thread. Now, the thread will take the query and parse it and it will look for the data to be read from the disk /buffer. The SQL server engine will put this thread in a suspended state and look for the data from the disk/buffer. Once the data is read from DB pages, then it will notify the thread (which is in a suspended state) that data is ready for processing and the thread will be moved to a runnable queue.
If any threads are available, they will be immediately moved to the running queue, data processing occurs and the requested data will be provided to the application server and the thread will be freed.
A SQL server keeps track of where the thread is spending time (suspended, runnable, running) and the wait types in the case of a suspended queue. These metrics will be stored in the DMV (dynamic management views) and can be retrieved by simple queries against the DMV. This data will reside in the DMV until the next SQL server engine restart.
The sys.dm_os_wait_stats dynamic management view can be used to obtain information about the wait type details. This view holds cumulative statistics about the wait types until the database engine is restarted or the wait statistics cleared manually.
Sample code from sqlhacks.com is below:
1
2
3
4
5
6
7
8
9
10
11
12
13
14
15
16
17
18
19
20
21
22
23
24
25
26
27
28
29
30
31
32
33
34
35
36
37
38
39
SELECT TOP 10 wait_type
AS [Wait Type],
                wait_time_ms/1000.0
AS [Total Wait Time (second)],
                (wait_time_ms-signal_wait_time_ms)/1000.0
AS [Resource Wait Time (second)],
                signal_wait_time_ms/1000.0
AS [Signal Wait Time (second)],
                waiting_tasks_count
AS [Wait Count]
FROM sys.dm_os_wait_stats
WHERE wait_type NOT IN
(N'CLR_SEMAPHORE',
    N'LAZYWRITER_SLEEP',
    N'RESOURCE_QUEUE',
    N'SQLTRACE_BUFFER_FLUSH',
    N'SLEEP_TASK',
    N'SLEEP_SYSTEMTASK',
    N'WAITFOR',
    N'HADR_FILESTREAM_IOMGR_IOCOMPLETION',
    N'CHECKPOINT_QUEUE',
    N'REQUEST_FOR_DEADLOCK_SEARCH',
    N'XE_TIMER_EVENT',
    N'XE_DISPATCHER_JOIN',
    N'LOGMGR_QUEUE',
    N'FT_IFTS_SCHEDULER_IDLE_WAIT',
    N'BROKER_TASK_STOP',
    N'CLR_MANUAL_EVENT',
    N'CLR_AUTO_EVENT',
    N'DISPATCHER_QUEUE_SEMAPHORE',
    N'TRACEWRITE',
    N'XE_DISPATCHER_WAIT',
    N'BROKER_TO_FLUSH',
    N'BROKER_EVENTHANDLER',
    N'FT_IFTSHC_MUTEX',
    N'SQLTRACE_INCREMENTAL_FLUSH_SLEEP',
    N'DIRTY_PAGE_POLL',
    N'SP_SERVER_DIAGNOSTICS_SLEEP')
ORDER BY wait_time_ms-signal_wait_time_ms DESC;
This will provide results like below:
1
2
3
4
5
6
7
8
9
10
11
Wait Type	                        TotalWaitTime (s)	ResourceWaitTime (s)        Signal Wait Time (s)    Wait Count
QDS_PERSIST_TASK_MAIN_LOOP_SLEEP	14700.292000	        14700.285000	            0.007000	            246
PAGEIOLATCH_SH	                        564.933000	        563.587000	            1.346000	            47088
WRITELOG	                        149.947000	        149.598000	            0.349000	            6445
PAGEIOLATCH_EX	                        49.911000	        49.896000	            0.015000	            4486
PWAIT_ALL_COMPONENTS_INITIALIZED	31.028000	        31.028000	            0.000000	            5
PREEMPTIVE_OS_DEVICEOPS	                27.685000	        27.685000	            0.000000	            8041
IO_COMPLETION	                        21.395000	        21.380000	            0.015000	            4020
MEMORY_ALLOCATION_EXT	                16.901000	        16.901000	            0.000000	            7509349
LCK_M_U	                                12.684000	        12.683000	            0.001000	            26
WAIT_XTP_HOST_WAIT	                11.446000	        11.446000	            0.000000	            6
The same data can be visualised with DBmarlin as a pie chart. Refer to the images above.
DBmarlin Identifies the Problem
Now I know that DB worker threads spent more time on the suspended queue with most of the wait time occurring in PAGELATCH_UP wait time. With the help of DBmarlin, I can find which query is taking a longer time in this wait type.
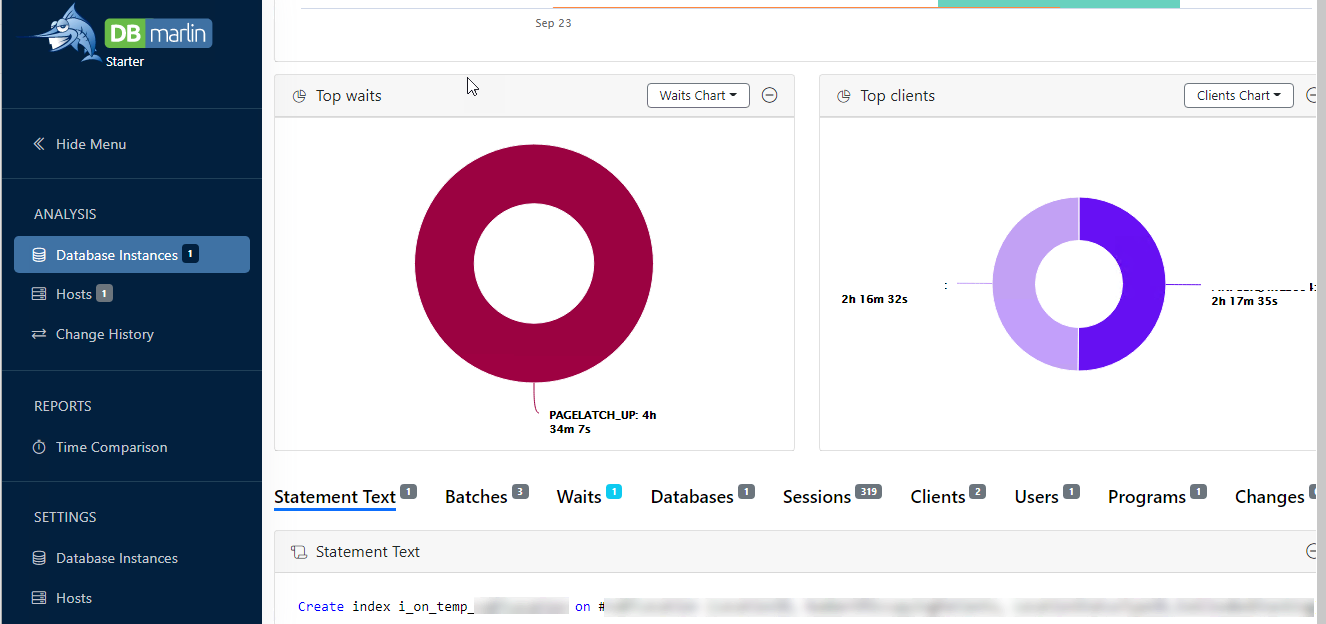
This is one of the queries in a list that is causing a PAGELATCH_UP wait type event.
The PAGELATCH_UP wait type accumulates while page latches are in update mode. Update mode is not just for UPDATE operations; it’s used when the SQL needs to read and then modify a page. Before modification, it will place an update on the data when ready to upgrade this to an exclusive latch. If this wait type is high, then the common problem of PFS contention may be present alongside the tempdb related contention.
The rule of thumb is one tempDB file for four CPU cores.
When we created more tempDB files according to our infrastructure then ran a similar load, this wait type disappeared and we also experienced good response times.
The Azure snapshot below shows much improved DB performance. Look at the DB reads/writes per second below which are 2-3x higher than previously while CPU is down by more than 30%.
DBmarlin shows that waits for PAGELATCH_UP have disappeared after changing the number of TempDB files according to the rule of thumb above.
DBmarlin Knowledge base
Something new which the DBmarlin team just added in their 1.9 release is their Knowledge base which would have helped me find the answers I needed even faster. The knowledge base is a free resource containing the descriptions of over 820 wait events across SQL Server and other DBmarlin supported databases. For example in my case I could have clicked through from the PAGELATCH_UP in the product and been taken straight to the page below.
In conclusion
I am happy that I found DBmarlin when I did. It helped me to get to the root cause of the problem quickly. I really like the nice clear graphical view which is so much easier to work with than running queries against the SQL Sever DMVs directly. I would definitely recommend DBmarlin for anyone doing performance testing and especially those without deep database performance expertise as this tool will make your job a lot easier.
This was originally published on LinkedIn here. https://www.linkedin.com/pulse/performance-engineering-tempdb-file-contention-dbmarlin-ezhil-arasu